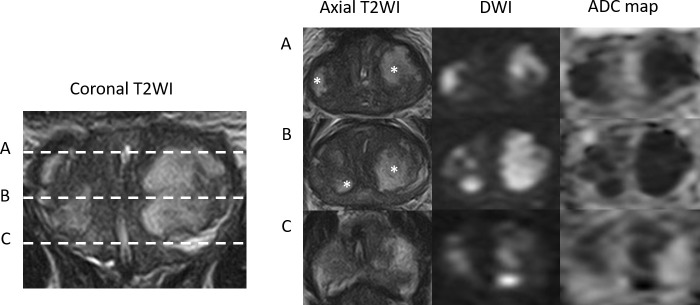
Figure 1.
Case 1: Coronal T2WI and axial T2WI, DWI (b-value 1400) and ADC maps at the levels of prostate base (A), mid gland (B) and apex (C), demonstrating diffuse low T2 SI in the PZ and TZ and interspersed by multifocal areas of high T2 SI (asterisk). These areas show high SI on the DWI and very low SI on the ADC maps resulting in a PI-RADS score of 5.

