
Figure 5.
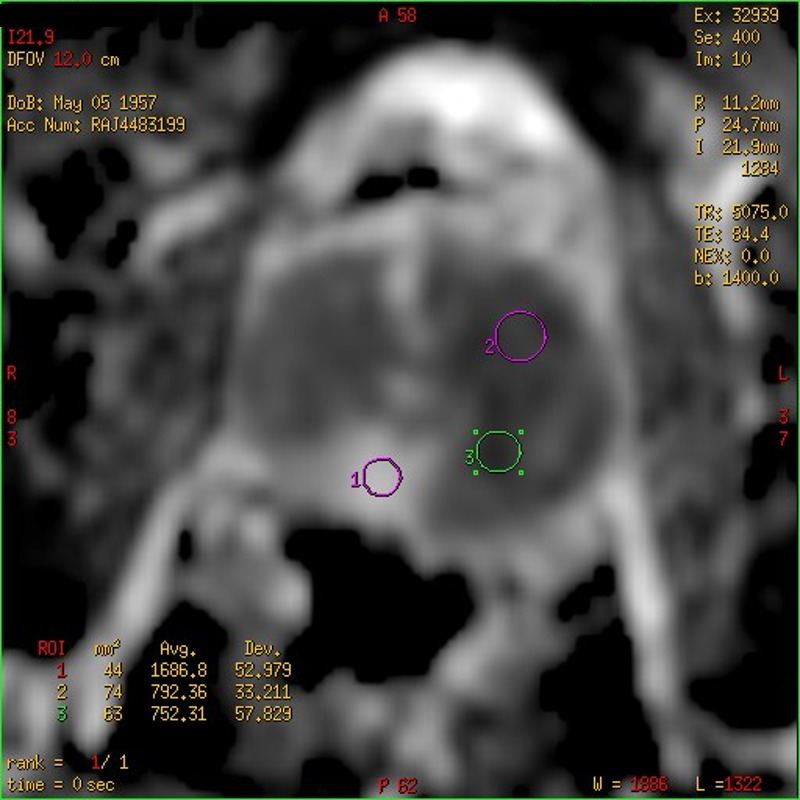
Case 2: ADC map showing the ADC values (10−6 mm2/s) for three ROIs placed in the spared posteromedial right PZ (circle 1 – ADC value 1686) and in two areas of very low SI on the ADC map (circle 2 – ADC value 792 and circle 3 – ADC value 752) indicating marked restricted water diffusion.