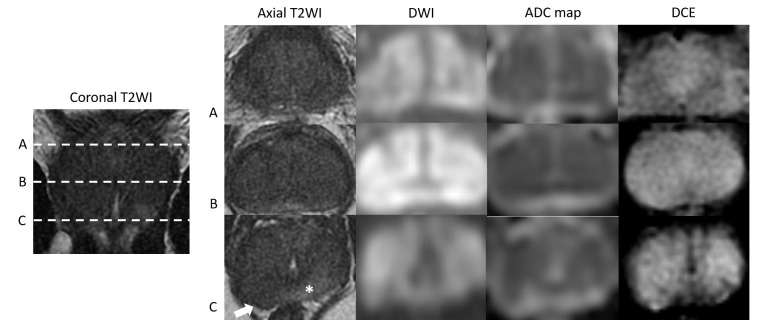
Figure 6.
Case 3: Coronal T2WI and corresponding axial T2WI, DWI (b-value 1400), ADC maps and DCE images at the levels of prostatic base (A), mid gland (B) and apex (C), demonstrating diffuse low T2 SI in the PZ and TZ with a small area of relatively preserved normal SI in the posterior apical PZ (asterisk). The majority of the prostate is high in SI on the DWI and low in SI on the ADC map and shows diffuse hyperenhancement on DCE. This results in a PI-RADS score of 5 for both T2WI and DWI and positive for DCE (PI-RADS v2). Note the area of capsular bulging in the right posterior apex (arrow).

