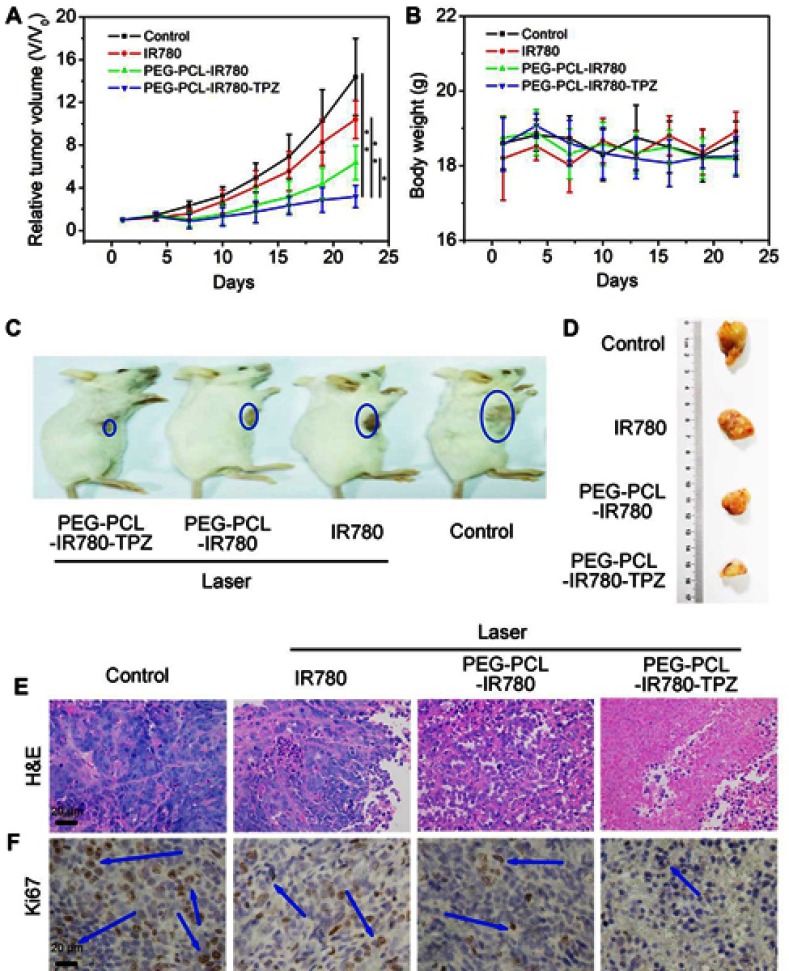
Figure 7.
(A) Tumor volume growth curves of 4T1-tumor-bearing mice subjected to various treatments (*p<0.05, **p<0.01, n=6). (B) Mice weight of 4T1-tumor-bearing mice subjected to various treatments. (C) Representative images of 4T1-tumor-bearing mice subjected to various treatments. (D) Representative images of tumor tissues separated from 4T1-tumor-bearing mice subjected to various treatments. (E) Hematoxylin-eosin (H&E) staining for tumor tissue slices of different groups. (F) Ki67 staining for tumor tissue slices of different groups. Blue arrows indicate the positive expression of proliferation marker Ki67.
Abbreviations: PEG-PCL-IR780-TPZ NPs, polyethylene glycol-polycaprolactone-2-[2-[2-Chloro-3-[(1,3-dihydro-3,3-dimethyl-1-propyl-2H-indol-2-ylidene)ethylidene]-1-cycloxen-1-yl]-ethenyl]-3,3-dimethy-1-propyl-1H-indolium iodide-tirapazamine nanoparticles.

