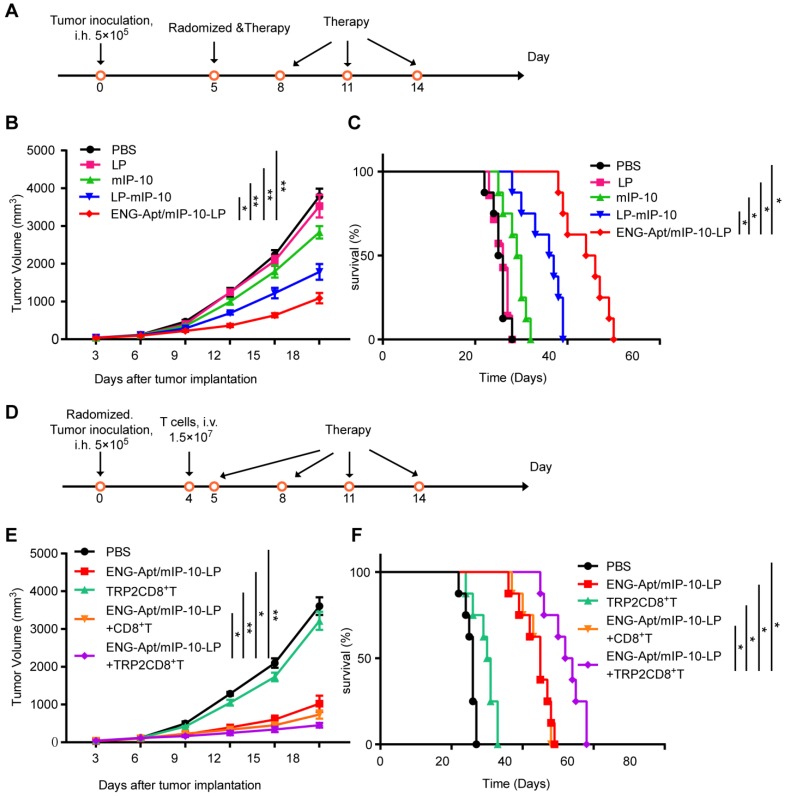
Figure 4.
Tumor volume and survival time in melanoma-bearing mice in different treatment groups. (A, B, C) Anti-tumor effect of the treatment with ENG-Apt/mIP-10-LP nanocapsules in melanoma-bearing mice. (A) Experiment design for the treatment of melanoma-bearing mice with ENG-Apt/mIP-10-LP nanocapsules. B16 cells (5×10⁵ cells/mouse) were inoculated into the right groin area of the C57BL/6 mice via subcutaneous injection. On the fifth day after the tumor cell inoculation, these tumor-bearing mice were then randomized into four groups (n=5), and respectively treated with PBS, mIP-10 plasmid, mIP-10-LPs, or ENG-Apt/mIP-10-LP nanocapsules at 5, 8, 11, and 14 days after tumor cells inoculation via tail vein intravenous injections. Another 32 mice subjected to the same treatments (n=8) were monitored to generate survival curves. (B) Showing tumor growth curves in mm3 among groups over the days after the treatment (n=5). (C) showing the survival rates of mice among groups over the days after the treatment (n=8). * p < 0.05, ** p <0.01 for the comparison of survival percentage in the ENG-Apt/mIP-10-LP group and control groups. (D, E, F) Anti-tumor effect of combination treatment with ENG-Apt/mIP-10-LP nanocapsules and adoptive TRP2CD8+ T cells in melanoma-bearing mice. (D) Experiment design for the combination treatment of melanoma-bearing mice with ENG-Apt/mIP-10-LP and TRP2-specific CD8+ T cells. C57BL/6 mice were randomized into five groups (n=5). Four days after subcutaneous inoculation of B16 cells, CD8+ T cells or TRP2-specific CD8+ T cells were resuspended in PBS at 1.5×10⁷ cells/mL (200 µL/mouse) via the tailvein injection in vivo. The next day, PBS and ENG-Apt/mIP-10-LP nanocapsules (mIP-10 plasmid, 50 µg/mouse) were also injected intravenously in the corresponding groups. Mice of different groups were treated at 5, 8, 11, and 14 days after tumor cells inoculation via tail vein intravenous injections. Another 40 mice subjected to the same treatments (n=8) were monitored to generate survival curves. (E) showing tumor growth curves in mm3 among groups over the days after the treatment (n=5). (F) showing the survival rates of mice among groups over the days after the treatment. * p < 0.05, ** p < 0.01 for the comparison of survival percentage between the ENG-Apt/mIP-10-LP + TRP2CD8+ T group and control groups. Mean ± SE of three independent experiments is shown.

