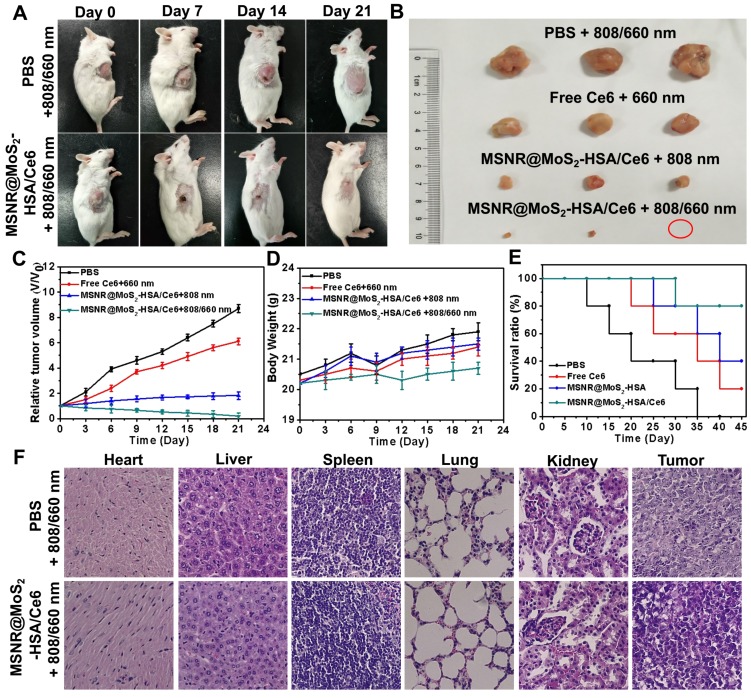
Figure 6.
(A) Photos of 4T1 cell-bearing mice with different treatments. (B) Photographs of tumor tissues peeled from groups treated with different formulations at the end of treatment. (C) Tumor volumes changes (D) Body weight changes (E) Percent survival of tumor-bearing mice of different groups (n = 5) with different treatments. (F) H&E stained images of major organs and tumor collected from different groups.

