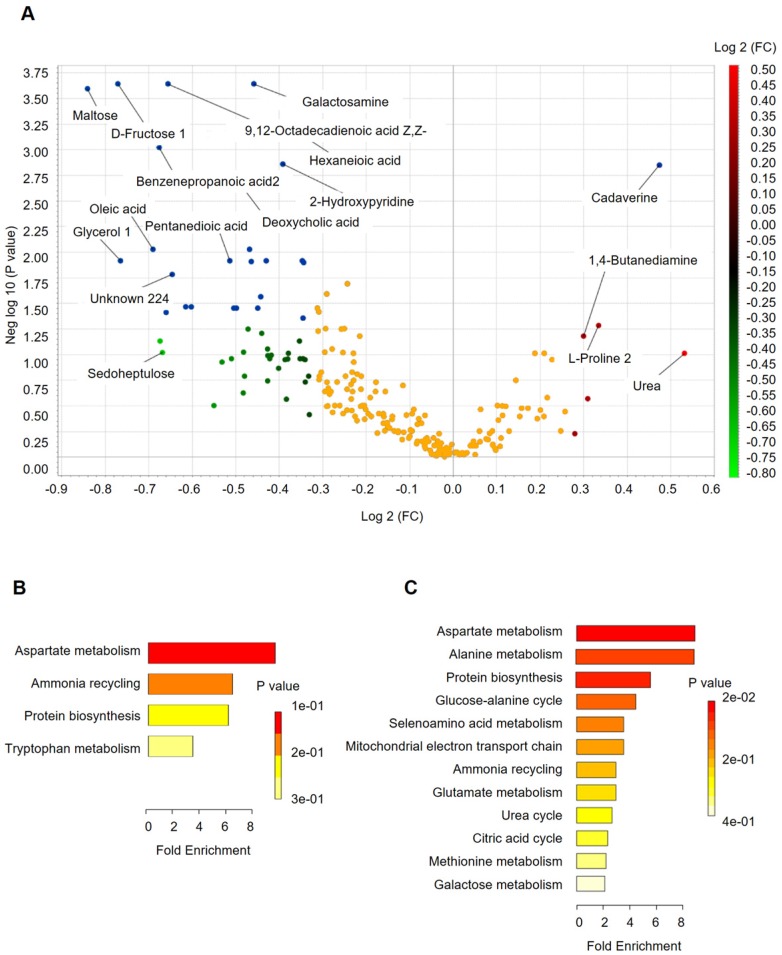
Figure 4.
Fecal metabolomics for quantification of metabolites in both the H and CRC groups. (A) Volcano plot showing the differentially accumulated [log2 (fold-change) on X-axis] and significantly changed [-log10 (p) on Y-axis] metabolites in the H and CRC groups. (B) Pathway enrichment and statistical significance of the 17 metabolites that were only present in CRC patients. (C) Pathway enrichment and statistical significance of the 42 metabolites unique to the H group.

