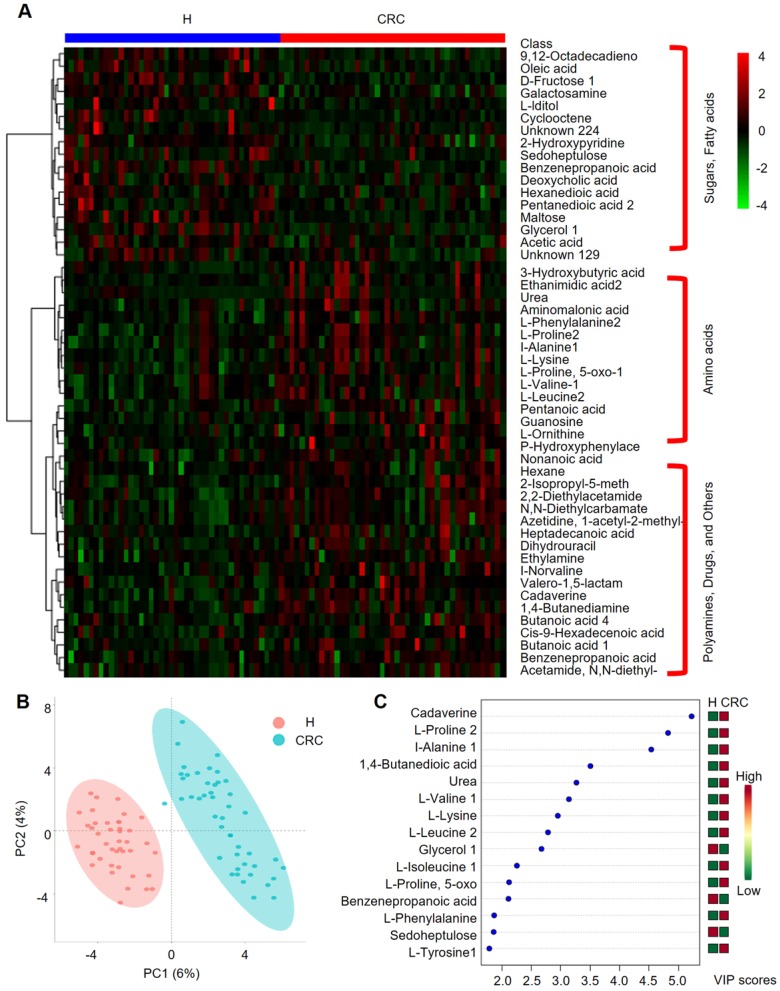
Figure 5.
Important discriminatory metabolites identified by clustering, correlation and multivariate analysis between the H and CRC groups. (A) Hierarchical clustering analysis (HCA) for the H and CRC group metabolites based on their z-normalized abundances. The three large clusters from top to bottom are (i) sugars and fatty acids, (ii) amino acids, and (iii) polyamines, drugs and others. (B) OPLS-DA analysis displaying the grouped discrimination of the H and CRC groups by the first two PCs. (C) Variable Importance in Projection (VIP) scores of the important discriminatory metabolites obtained from the OPLS-DA models.

