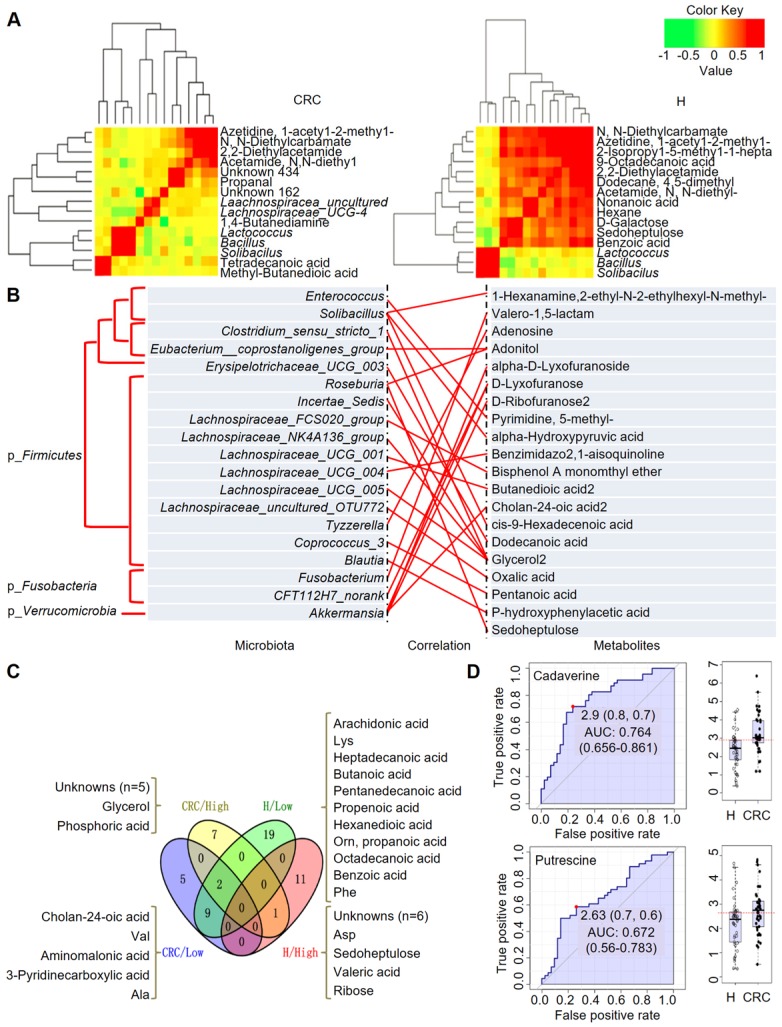
Figure 6.
Integrated correlation-based network analysis of microbes and metabolites. Pearson's correlation analysis from the entire network in the CRC group and H group. (A) Firmicutes (Bacillus, Solibacillus and Lactococcus) were grouped with tetradecanoic acid (myristic acid) and methyl-butanedioic acid (methylsuccinic acid) in the CRC group. In the H group, Firmicutes (Bacillus, Solibacillus and Lactococcus) were grouped with sugars (d-galactose, sedoheptulose), sugar alcohols, and organic acids, such as nonanoic acid, benzoic acid and others (hexane, 1-acetyl-2-methyl-azetidine). (B) Integrated correlation-based network analysis (Pearson's correlation) of microbes and metabolites. (C) A four-way Venn diagram displaying the coefficient of variation (CV) of four groups of metabolites in the CRC (< 0.25), CRC (> 0.75), H (< 0.25), and H (> 0.75) groups. CVs were obtained ranging from 0-1, in which 0-0.25 was classified as the least variable, and 0.75-1 was classified as highly variable. (D) Biomarker analysis for metabolite abundance showing the high AUCs for cadaverine and putrescine.

