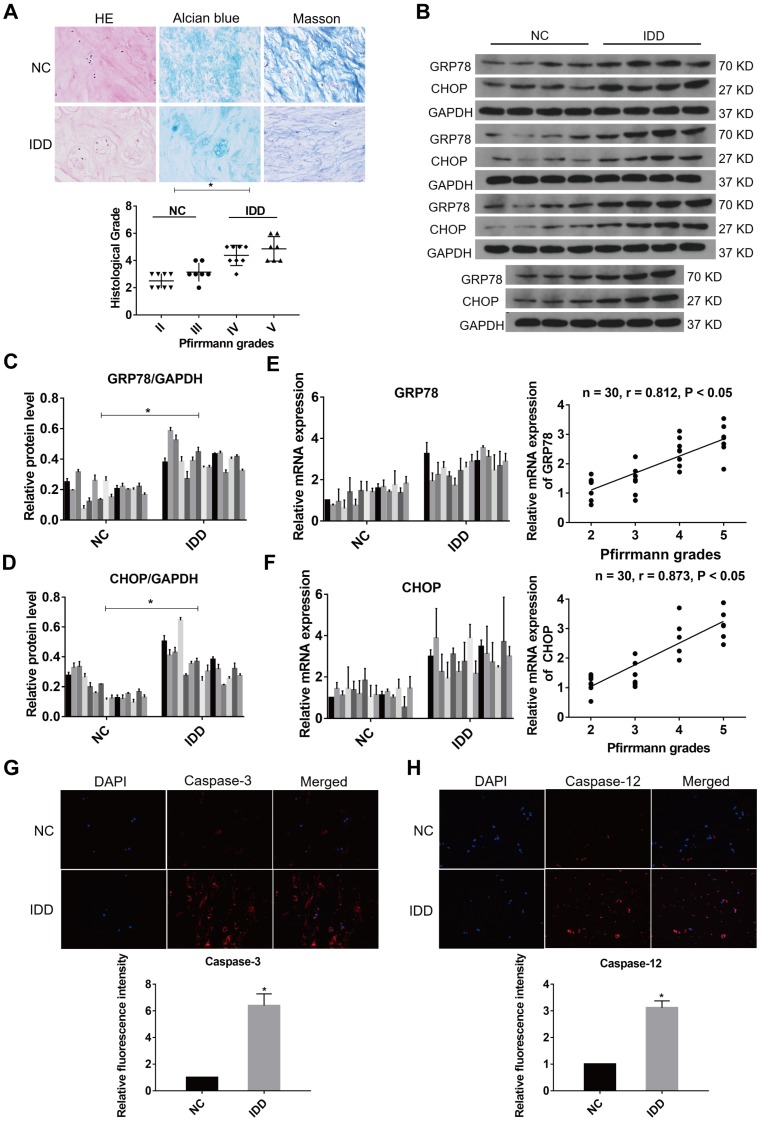
Figure 1.
ER stress level during IDD in human NP tissues. (A) Representative histological images of normal or degenerative NP tissues in HE, Alcian blue and Masson staining. Magnification: 400 ×. Histological grades of NP tissues were evaluated and analyzed. *P < 0.05. (B-D) The protein levels of GRP78 and CHOP were analyzed by western blot analysis (B) and the relative quantitative data (C, D) was calculated accordingly. GAPDH was used as an internal control. *P < 0.05 vs NC group. (E) GRP78 mRNA level was measured by qRT-PCR in normal and degenerative NP tissues (left panel). A correlation between GRP78 mRNA level and Pfirrmann grades of NP tissues (n = 30) was determined by nonparametric linear regression (right panel). (F) CHOP mRNA level was analyzed by qRT-PCR (left panel) and linear regression confirmed a correlation between CHOP mRNA level and Pfirrmann grades of NP tissues (n = 30) (right panel). (G-H) Representative images of caspase-3 (G) and caspase-12 (H) expression was detected by immunofluorescence analysis and the relative fluorescence intensity was calculated in normal and degenerative NP tissues. Magnification: 400 ×. *P < 0.05 vs NC group.

