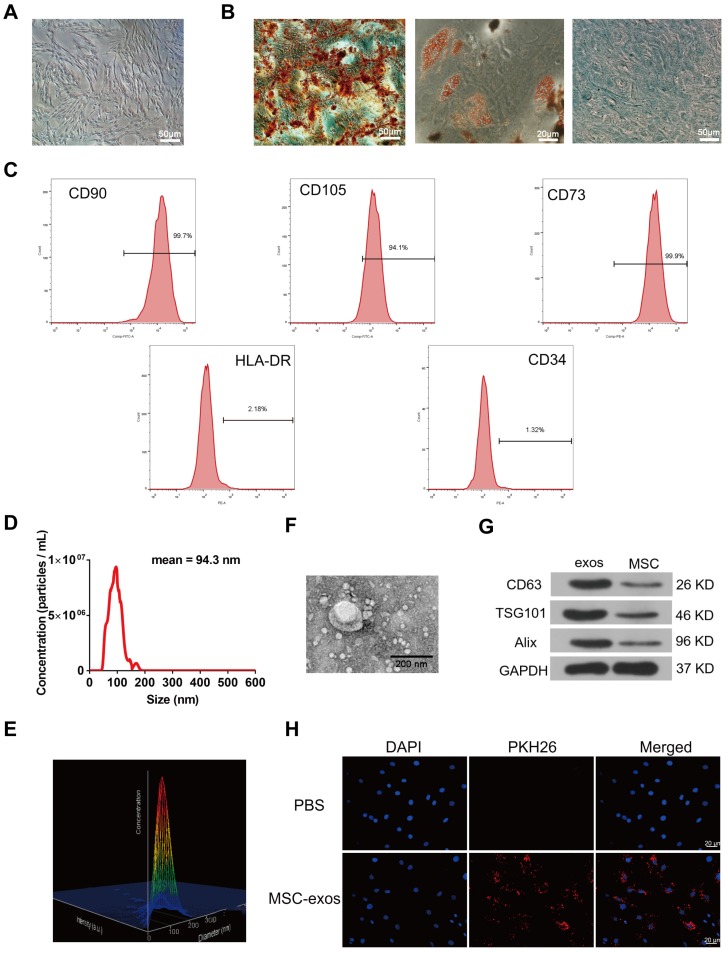
Figure 2.
Identification of human bone marrow MSC and exosomes (MSC-exos). (A) Representative images of MSC spindle-like morphology and adherence to plastic (scale bar: 50 μm). (B) The ability of MSC to differentiate into the osteogenic, chondrogenic, and adipogenic lineages was confirmed by Alizarin Red staining (left panel, scale bar: 50 μm), Oil Red O staining (middle panel, scale bar: 20 μm) and Alcian blue staining (right panel, scale bar: 50 μm), respectively. (C) Cell surface markers (CD90, CD105, CD73, CD34 and HLA-DR) of MSC was detected by flow cytometric analysis. (D) Particle size distribution of MSC-exos was measured by nanoparticle trafficking analysis (NTA). (E) A three-dimensional plot according to the NTA results showed the stereo picture of MSC-exos size distribution. (F) Typical image of MSC-exos morphology was captured by transmission electron microscopy (TEM) (Scale bar: 200 nm). (G) Protein markers of MSC-exos were detected by western blot analysis in exosomes and MSC cells. (H) Representative images of NP cells incubated with PBS or PKH26-labelled MSC-exos for 12 h. The nuclei of NP cells were stained by DAPI (blue). Magnification: 400 ×, scale bar: 20 μm.

