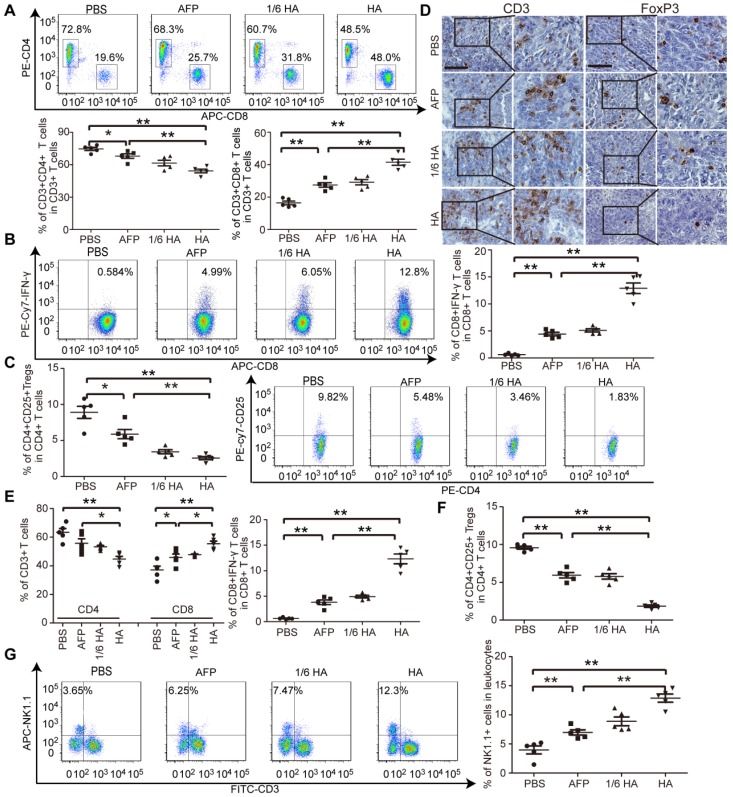
Figure 5.
Measurement of immune microenvironment in treated autochthonous HCC mice. Flow cytometric analysis of CD4+ or CD8+ T lymphocytes (A) or IFN-γ-expressing CD8+ T lymphocytes (B) or CD4+CD25+ Tregs (C) in blood from autochthonous C57BL/6 HCC mice treated with PBS, lenti-AFP or lenti-HA (n=5, *P<0.05;**P<0.01). (D) Immunohistochemistry of CD3+ T cells and Foxp3+ Tregs in tumor sections from different treatment samples to determine the extent of T cell infiltration (scale bar = 100 μm). Flow cytometric analysis of CD4+ or CD8+ T lymphocytes and IFN-γ-expressing CD8+ T lymphocytes (E) or CD4+CD25+ Tregs (F) in tumor tissues from autochthonous C57BL/6 HCC mice treated with PBS, lenti-AFP or lenti-HA (n=5, *P<0.05; **P<0.01). (G) Flow cytometric analysis of natural killer (NK) cells in blood from autochthonous HCC mice treated with lenti-HA or lenti-AFP (n=5, **P<0.01). Two-tailed t test was used for statistical analysis.

