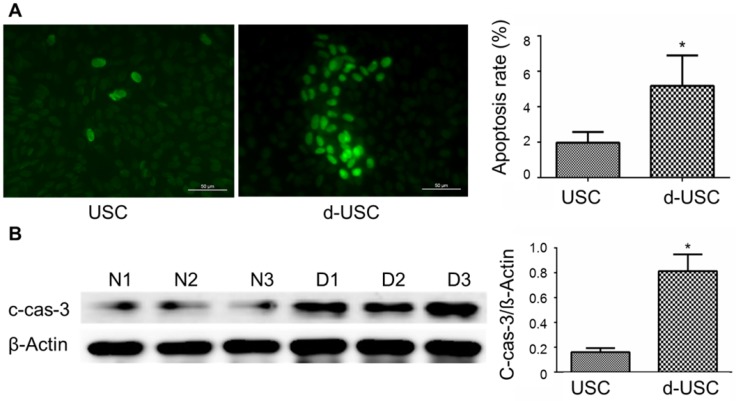
Figure 9.
Apoptosis and apoptosis-related protein in d-USC. (A) Marker of apoptosis expressed positive in d-USC at p5 with TUNEL staining (green), compared to that in USC at p5 24 hours after seeding at 5 x 10⁵ cells/well in a 6-well plate, captured by a fluorescence microscope (400×). Numbers of cells expressed apoptosis‐related marker in d-USC (n = 10 samples) was significantly higher compared to those in USC (n=10 samples) (*p<0.01). Data represented mean ± SD. (B) The d-USC expressed significantly higher amount of apoptosis-related protein c-cas-3 protein compared to USC (p5) samples (*p<0.01). Data were presented as mean ± SD, assessed with Western Blot

