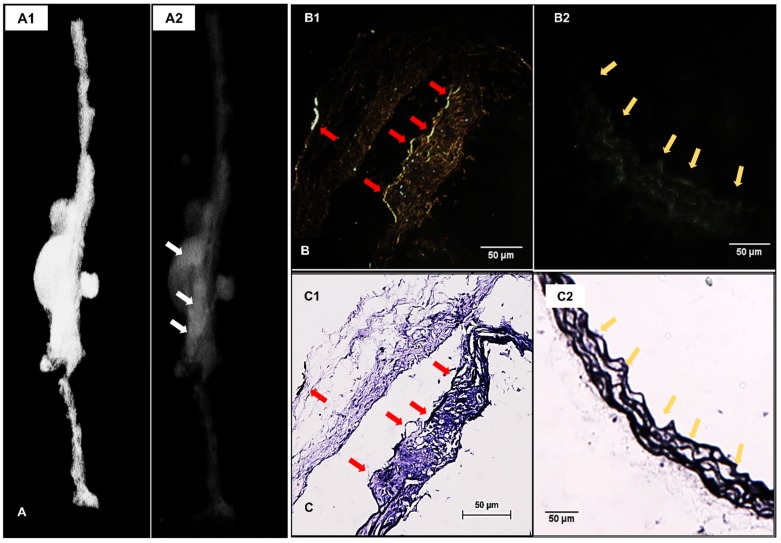
Figure 3.
Localization of EL-GNPs within aneurysmal tissues. A. 3D model that visualizes the explant morphology of an aneurysmal aorta (A1) and attenuation mode that shows the distribution of degraded elastin targeting gold nanoparticles within the whole aorta (A2). A stronger signal was shown in the aneurysmal aortic segment than the healthy aortic segment. B. Enhanced dark field microscopy and C. histological analysis of elastin with Verhoeff van Gieson staining. A stronger darkfield microscopy signal was found in the section (B1) which showed more elastin damage (C1) than the control section (B2) that contained only intact elastin fibers (C2). Signal given by gold nanoparticles was found at the positions where degraded elastin was present, indicated by red arrows, while healthy and intact elastin fibers were devoid of signal as indicated by yellow arrows. Scale bar =50µm.

