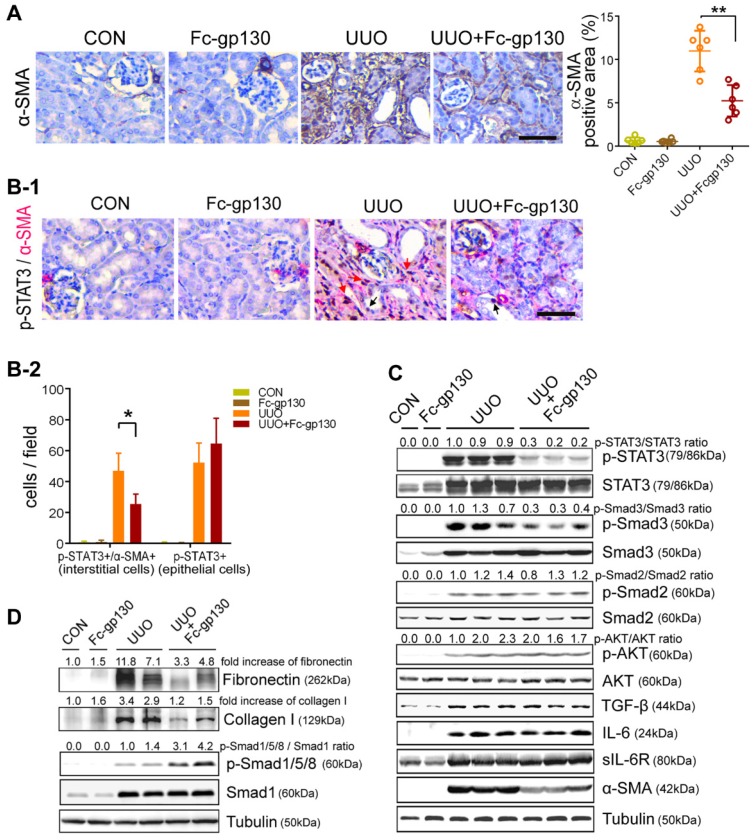
Figure 3.
Fc-gp130 suppressed STAT3 activation in renal tissues of UUO mice. (A) Immunohistochemistry and quantitative analysis of α-SMA content in renal tissue. (B) Immunohistochemistry of p-STAT3 (brown) in fibroblasts (α-SMA, red) from renal sections. Red arrows denote p-STAT3 and α-SMA co-positive interstitial cells, black arrows denote p-STAT3 positive epithelial cells (B-1), and quantitative analysis of positive cells (B-2). Scale bar, 50 μm. Data are means ± SD, n = 6 pre group; *p < 0.05, ** p < 0.01. (C-D) Renal tissue samples were collected on day 14 after UUO and Fc-gp130 treatment. Western blotting analysis of phosphorylated (p)-STAT3, total STAT3, p-Smad3, Smad3, p-Smad2, Smad2, p-AKT, AKT, TGF-β, IL-6, sIL-6R, α-SMA (C), Fibronectin, Collagen I, p-Smad1/5/8, Smad1 and tubulin in renal lysates (D). Each experiment was performed at least in triplicate.

