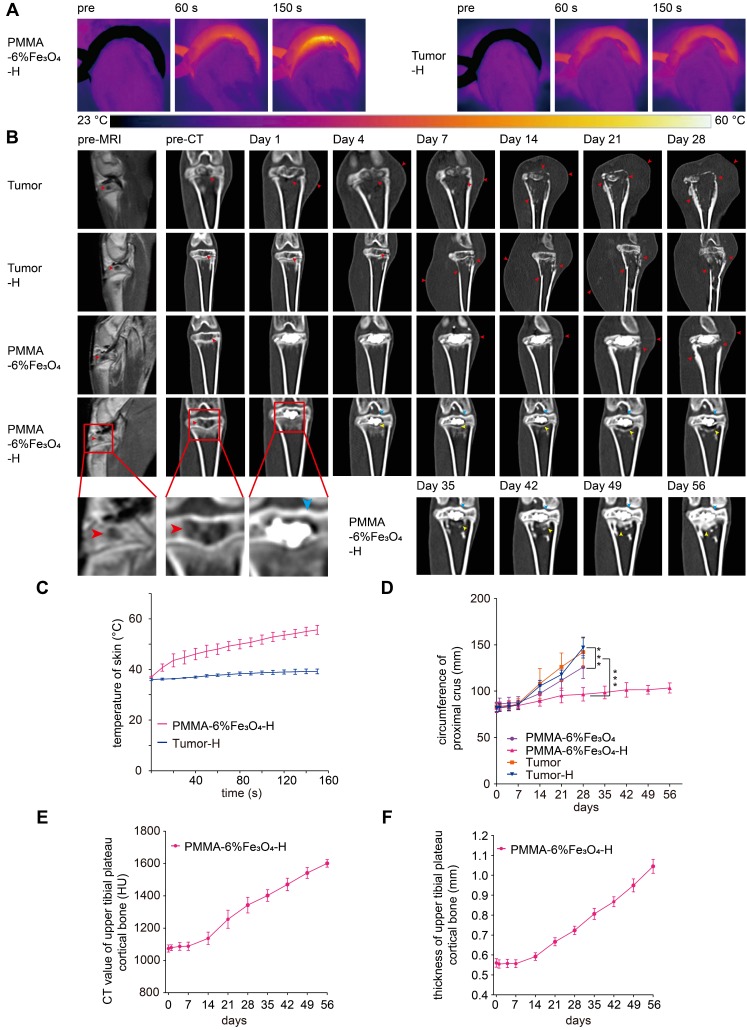
Figure 5.
In vivo magnetic thermal therapy for tumor and follow-up CT coronal reconstruction examination. (A) Thermal images of rabbit leg in the PMMA-6%Fe3O4-H group and Tumor-H group and (C) the corresponding temperature-time curve. (B) Enhanced MRI images and coronal reconstructed CT images at each follow-up time point (red arrow: bone destruction and swelling of soft tissue, blue arrow: cortical bone of upper tibial plateau, yellow arrow: area of bone resorption and new bone formation). (D) Curve of the circumference of the proximal crus change over time. (E) Curve of the CT value of the upper tibial plateau cortical bone change over time. (F) Curve of the thickness of the upper tibial plateau cortical bone change over time.

