
Figure 1. f3(Tianyuan, X; Mbuti) for All Sites Where X Is a Present-Day Human Population or an Ancient Individual.
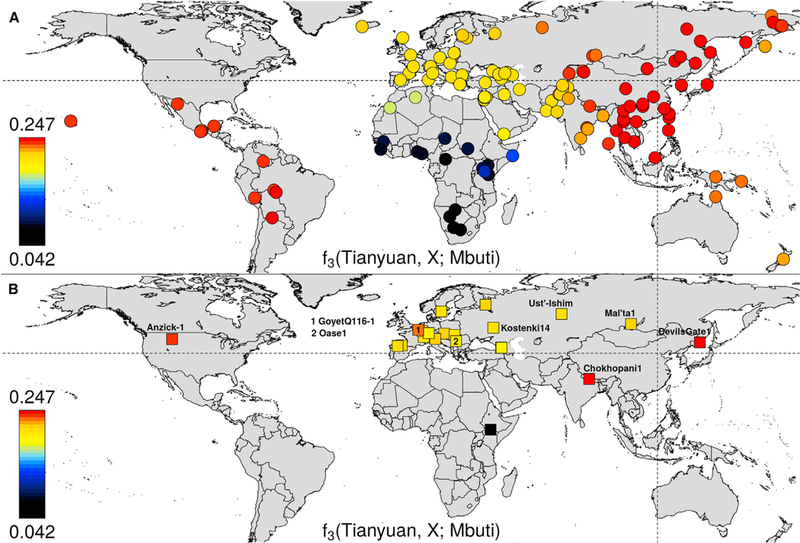
The f3 statistic ranges from 0.04 to 0.25. A higher value (red) indicates higher shared genetic drift between the Tianyuan individual and the (A) present-day population or (B) ancient individual. The intersection of the dotted lines indicates where the Tianyuan Cave is located. See also Table S2A.