
Figure 2. Comparisons Relating the Tianyuan Individual to Ancient and Present-Day Eurasians and Native Americans.
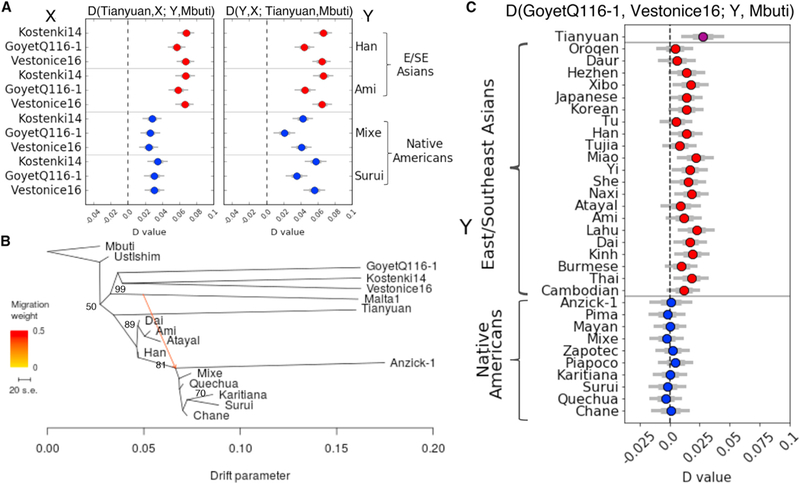
(A) D(Tianyuan, X; Y, Mbuti) and D(Y, X; Tianyuan, Mbuti), where Y is the East and Southeast Asian Han or Ami or the Native American Mixe or Surui and X is the ancient West Eurasian individual Kostenki14, GoyetQ116–1, or Vestonice16.
(B) Maximum-likelihood tree showing East and Southeast Asians, Native Americans, and ancient Eurasians, with bootstrap support of 100% unless indicated otherwise. The scale bar shows the average standard error (SE) of the entries in the covariance matrix.
(C) D(GoyetQ116–1, Vestonice16; Y, Mbuti), where Y is the Tianyuan individual, an East and Southeast Asian population, or a Native American population.
For (A) and (C), thick bars are within 1 SE of the estimate, thin bars are within 1.96 SE of the estimate (95% confidence interval), and the dashed vertical line indicates D = 0. See also Figures S1 and S2 and Tables S2 and S3.