
Figure 3. Heatmap of D Statistics and Admixture Graph Model Comparing Native Americans to the Tianyuan Individual.
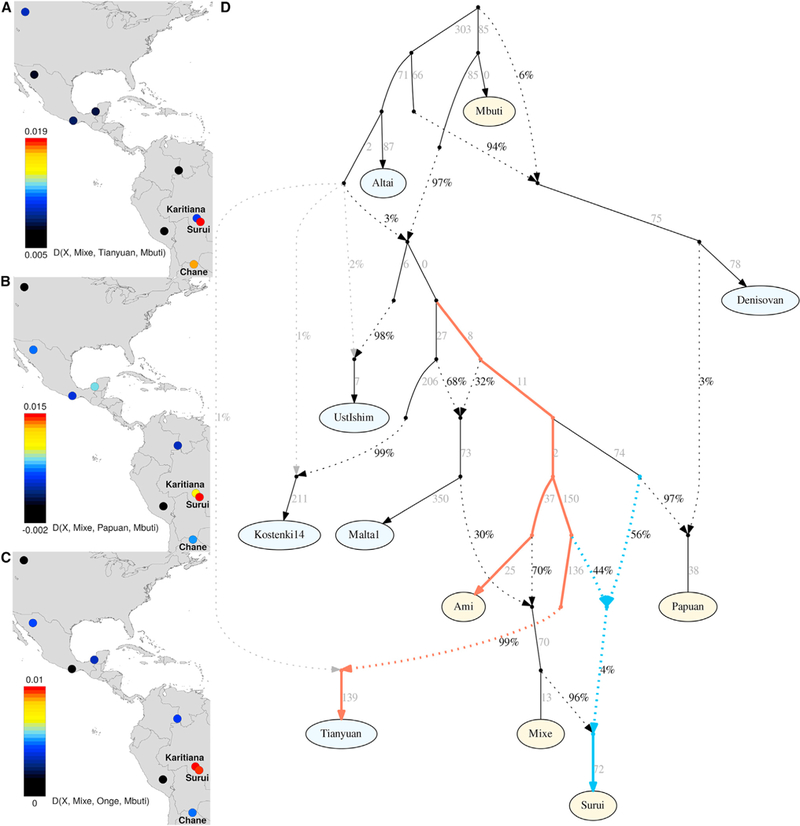
(A–C) Heatmaps of (A) D(X, Mixe; Tianyuan, Mbuti), (B) D(X, Mixe; Papuan, Mbuti), and (C) D(X, Mixe; Onge, Mbuti), where X are non-Mixe Native American populations.
(D) Admixture graph model that fits allele frequency patterns (all empirical f statistics are within 3 SEs of expectation). Branch lengths are shown in units of Fst × 1,000. Admixture from a population related to the Altai Neanderthal into ancient individuals (shaded gray) was collapsed into a single node, as were the original nodes atthetop ofthe graph (can be observed in Figure S4N). The orange lines indicate the edges leading totheTianyuan individual and the East and Southeast Asian Ami after splitting from the edge leading to Kostenki14. The blue lines indicate the edges showing ancestral components related totheTianyuan individual and the Papuan in the Native American Surui.See also Figure S4 and Table S2.