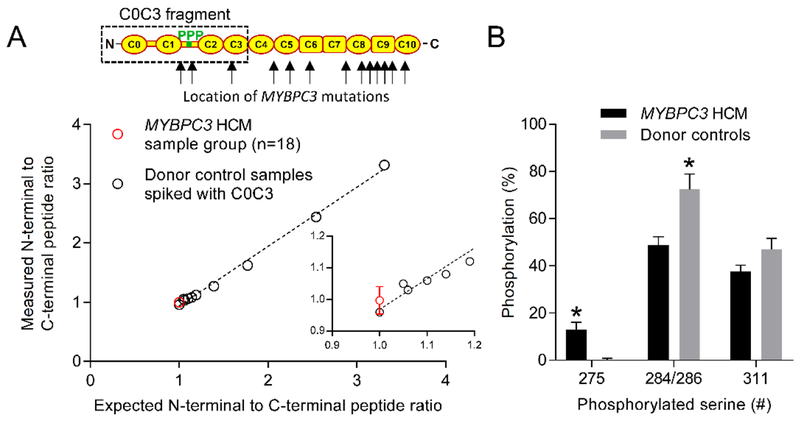
Fig. 3.
Quantification of the abundance of truncated MyBP-C and phosphorylation in the human heart samples. (A) Red data point (±SEM) is the grouped HCM N- to C-terminal MyBP-C peptide ratio determined from peptides N- and C-terminal to the first amino acid altered by each MYBPC3 mutation in the HCM samples. Black data points are N- to C-terminal peptide ratios generated from donor controls samples spiked with increasing concentrations of a bacterially expressed human C0C3 MyBP-C protein fragment. (B) Percent phosphorylation determined for serines 275, 284/286 and 311 in the HCM and donor samples. *P<0.01

