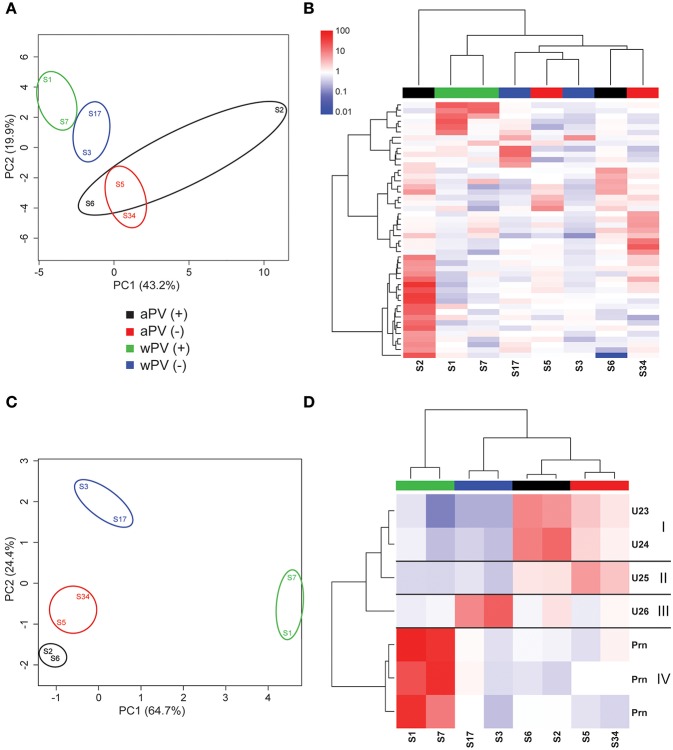
Figure 4.
IgA responses determined with 2-Dimensional electrophoresis and immunoblotting. The presence and intensity of IgA antibodies were determined in sera for eight individuals divided over four groups (n = 4). (A) Total variance of component 1 (PC1) and component 2 (PC2) were calculated of the total IgA responses analyzed by 2DEWB for each of the eight individuals in the four groups. (B) The intensity of IgA responses of 47 spots were compared (red = higher, white = equal, blue = lower) to a common reference (median of all intensities for each individual per spot). Euclidean clustering was performed to identify patterns in antibody profiles for both the eight individuals and the 47 spots. (C) Total variance of PC1 and PC2 were calculated of the significant IgA spots analyzed by 2DEWB for each of the eight individuals in the four groups. (D) The intensity of the seven spots (including the unidentified proteins U23–U26) that were found significant in the IgG response of all eight individuals divided over four groups (n = 4) were compared (red = higher, white = equal, blue = lower) to a common reference (median of all intensities for each individual per spot). Euclidean clustering was performed to identify patterns in antibody profiles for both the 8 individuals and the seven spots leading to four clusters (I–IV).

