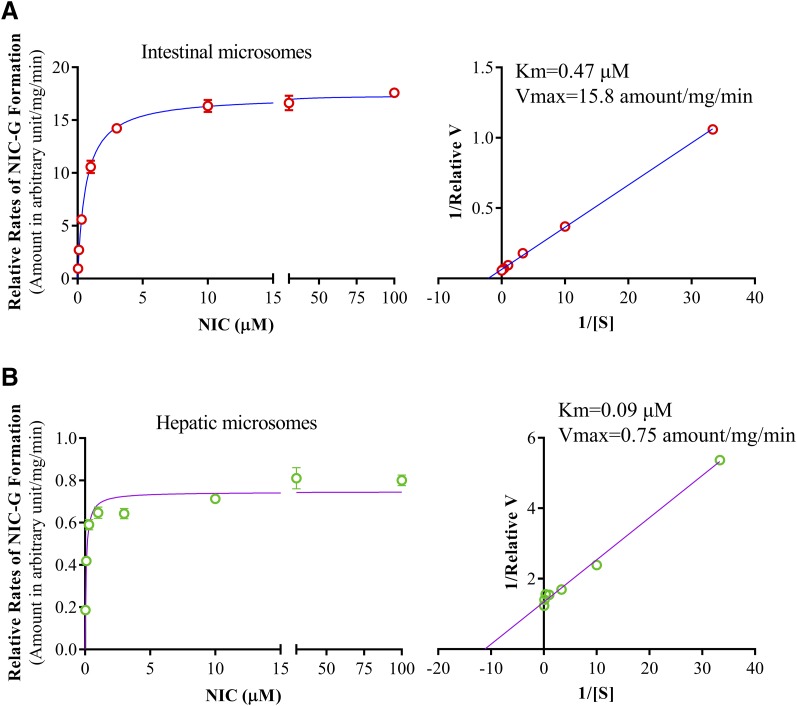
Fig. 4.
Enzyme kinetic profiles of NIC-G formation in intestinal and hepatic microsomes. Reaction mixtures contained 0.1 M potassium phosphate buffer (pH 7.4), 0.01 mg intestinal or hepatic microsomal protein, 0.03–100 µM niclosamide, 5.0 mM UDPGA, and 3 mM MgCl2 in a final volume of 200 µl. The reaction was carried out at 37°C for 2.5 minutes for intestinal microsomes. The values represent means ± S.D. of triplicate determinations using pooled intestinal (A) and hepatic (B) microsomes of six adult male wild-type mice. Rates of NIC-G formation are shown as relative amounts of NIC-G formed in arbitrary unit (determined by the ratio of NIC-G peak area over peak area of the internal standard nitrendipine) per milligram of microsomal protein, per minute. The apparent Km and Vmax values, calculated from the Lineweaver–Burk blots (right panel), are shown.

