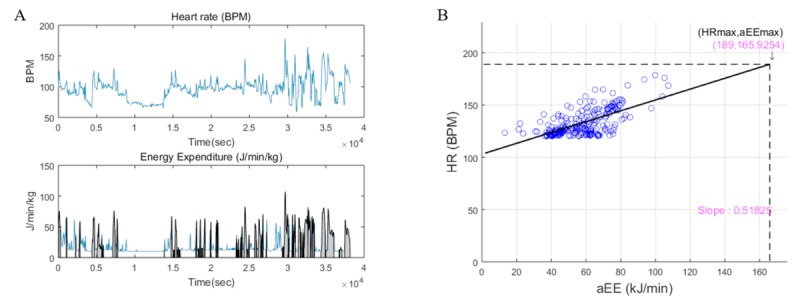
Figure 1.

(A) HR and aEE data from Fitbit. The shaded area indicates the period of data where both HR and aEE are increasing. (B) Scatter plot between selected periods of aEE versus HR of a representative subject. Data where HR was less than 120 bpm were removed to select the data where HR and aEE had a linear relationship. aEEmax is defined as the intersection between the interoperation line and HRmax, and the slope is the slope of the interpolation line. aEE: activity energy expenditure; aEEmax: maximal activity energy expenditure; BPM: beat per minute; HR: heart rate; HRmax: maximum heart rate.
