Figure 5.

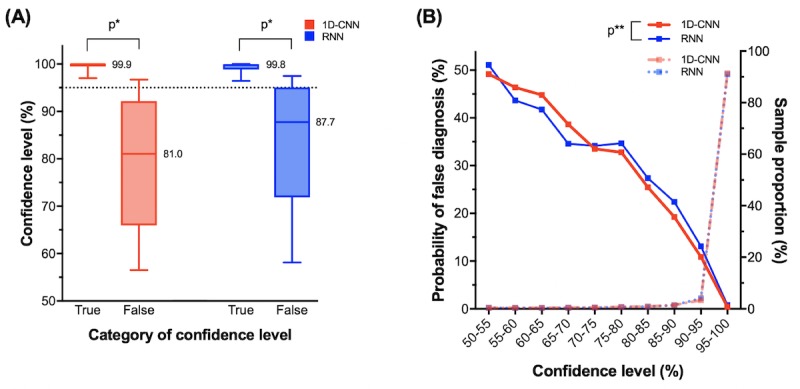
The characteristics of confidence level (CL) calculated by deep learning (DL) classifiers. Data were obtained by repeating the 5-fold cross-validation test over 10 times. (A) Comparison of true and false CLs of 1-dimensional convolutional neural network (1D-CNN) and recurrent neural network (RNN) methods by Box-and-Whiskers plot. True CLs indicate the cases where the diagnosis of a DL classifier was correct. Conversely, false CLs indicate cases where a DL classifier was incorrect. In the both 1D-CNN and RNN methods, the distributions of true or false CLs were significantly different (P<.001) for both 1D-CNN and RNN methods. If cut-off level of CL is to be 95% (dashed line), the diagnostic accuracy was 99.6% in 1D-CNN and 99.2% in RNN. Therefore, a diagnosis with a CL ≥95% can be regarded as certain. (B) The association between the probability of misdiagnosis and sample proportions and the respective CLs. Because 91% of the tested samples showed CL ≥95%, most diagnoses made by DL classifiers were valid. The probability of false diagnoses decreases from 50% to 0% as the CL increases from 50% to 100%. Comparing 1D-CNN and RNN, there was no significant difference in CLs (P=.98). *P<.001, calculated by Student t test. **P=.98, calculated by Student t test. 1D-CNN: 1-dimensional convolutional neural network; RNN: recurrent neural network.
