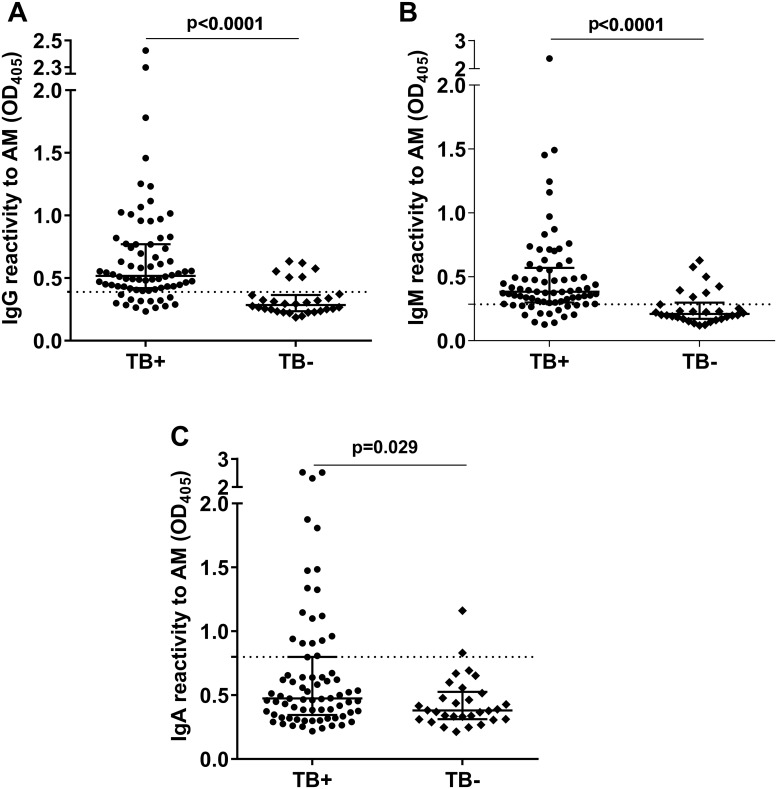
Fig 3. Comparison of antibody responses to AM between TB+ and TB- subjects.
(A) IgG to AM; (B) IgM to AM; (C) IgA to AM. Lines and error bars represent medians with interquartile ranges. Mann-Whitney U test was used for statistical comparisons. Dotted lines represent Ab level cut-off determined by receiver operating curve (ROC) at specificity of 80% showing a sensitivity for TB of 82%, 77%, and 46% for IgG, IgM, and IgA, respectively.

