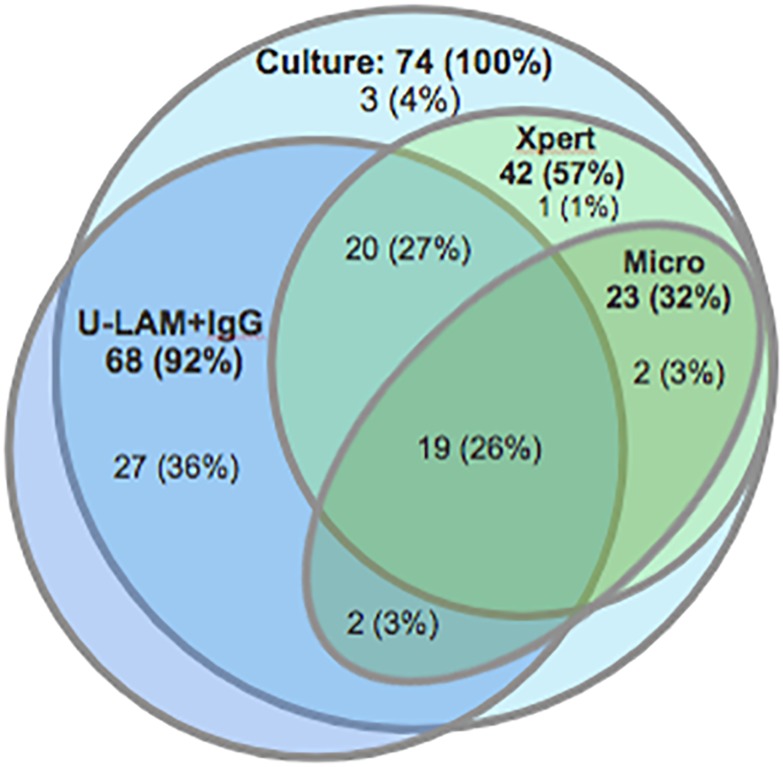
Fig 6. Venn diagram showing proportions of TB patients diagnosed by different test modalities relative to those diagnosed by mycobacterial culture (n = 74 (100%)).
Numbers in bold fonts represent patients testing positive by the respective test modalities while those in regular fonts show numbers and proportions of patients exclusively diagnosed by this/these compartment(s). Culture = M. tuberculosis culture positive; Xpert = initial sputum GeneXpert positive; Micro = two sputum smears for acid fast bacilli positive; and U-LAM+IgG = urinary LAM detection by urine dipstick test and/or IgG to AM positive. Of note, the dark blue fraction of the U-LAM+IgG circle extending outside the M. tuberculosis culture positive circle represents anti-AM IgG positive, culture negative subjects.

