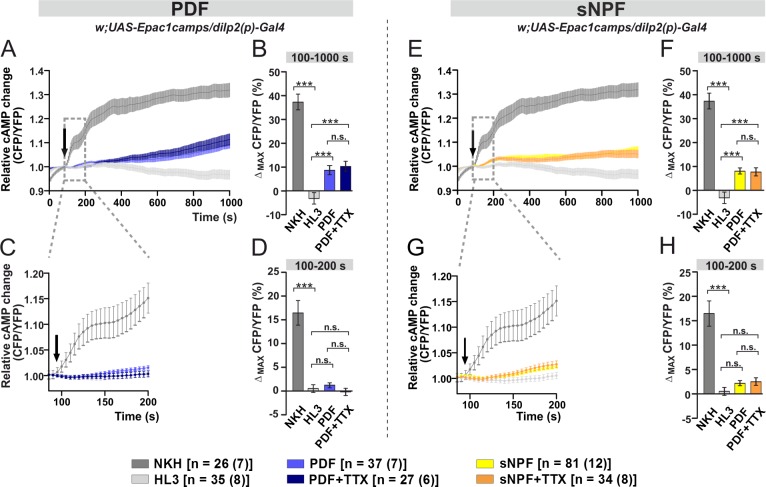
Fig 4. Bath-applied PDF and sNPF induce cAMP increases in the IPCs.
Live optical imaging in flies expressing a cAMP sensor in their IPCs (dilp2(p)>Epac1camps). Average inverse FRET traces (CFP/YFP) in IPCs reflecting intracellular changes in cAMP levels. Substances were bath-applied to freshly dissected fly brains at 100 s (indicated by black arrow). Application of 10−5 M adenylate cyclase activator NKH477 (NKH, dark gray) induced a robust increase in cAMP, indicating that the general procedure was working. As a negative control, hemolymph-like saline (HL3) was applied. (A) Bath-applied PDF (10−5 M) evokes cAMP increases in the IPCs (light blue), suggesting a possible functional connection between PDF+ cells and IPCs. Similar increase was observed when PDF was applied in the presence of 2μM sodium channel blocker tetrodotoxin (TTX; dark blue), indicating a direct connection. (B) Maximum inverse FRET changes quantified for each individual neuron and averaged for each pharmacological treatment between 100–1000 s. (C) A close-up of the immediate changes in cAMP levels occurring from the application point until 200 s. No significant changes can be observed when PDF or PDF+TTX were applied. (D) Maximum inverse FRET changes from 100–200 s. (E) Bath-applied sNPF (10−5 M) generates cAMP rises in the IPCs (yellow). Similar increase occurs in the presence of TTX (orange), thus suggesting a direct connection. (F) Maximum inverse FRET changes between 100–1000 s. (G) Magnification of the immediate changes between 100–200 s. (H) Maximum inverse FRET changes between 100–200 s. The legend shows the color code of the different treatments and the number of neurons in the dissected brains (in parentheses) considered in this analysis. Data are shown as mean ± SEM. Kruskal-Wallis test followed by Bonferroni-corrected Wilcoxon pairwise-comparisons. ***p<0.001, **p<0.01, *p<0.05, n.s. not significant.

