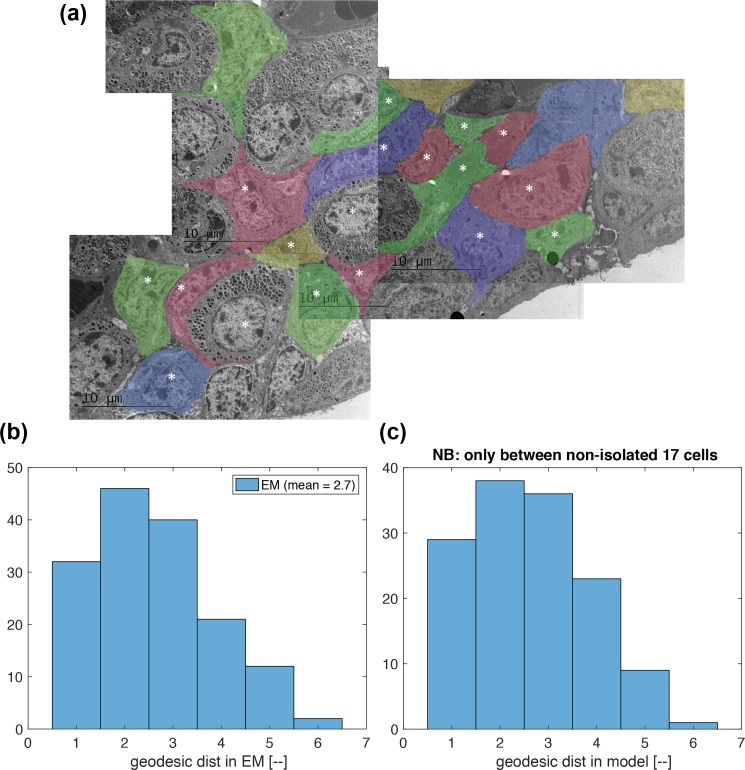
Fig 4. Distributions of geodesic distance compared between an electron microscopic (EM) image and the model applied to a GFP image.
(a) A montage of x800 EM images of anterior pituitary tissue, which is different from those GFP imaged (D1, D2, D3). Each lactotroph is shaded in a different colour to distinguish individual cells. There are 18 cells that are fully contained in this montage, and are labelled by *. (b) The distribution of geodesic distance estimated in the EM picture in (a). The 18 cells labelled by * are examined. (c) The distribution of geodesic distance estimated in the model with a GFP dataset. The 18 cells nearest to the tissue centre are examined (see Fig 1C). One cell was found to be isolated from the other 17 cells, causing the histogram y-axis limit smaller than that in (b).

