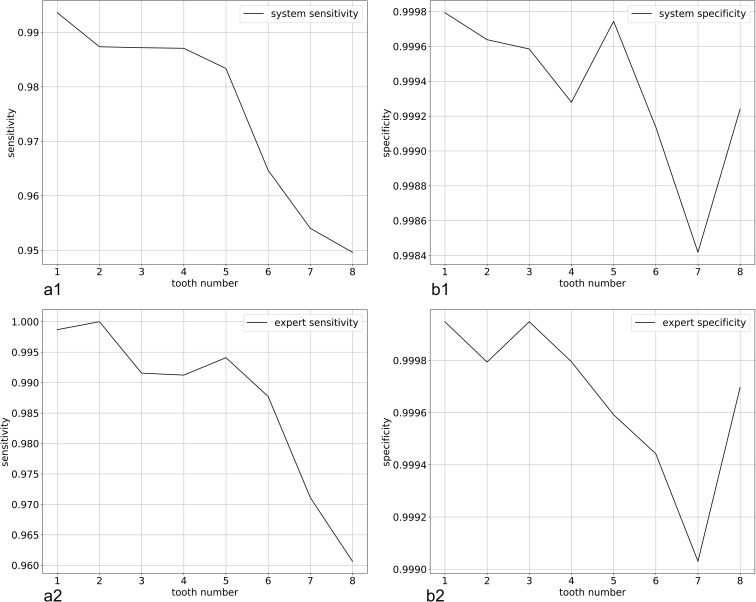
Figure 8.
Sensitivity and specificity plots for all teeth numbers. The plots show sensitivity and specificity for each of eight teeth numbers averaged by four quadrants: (a1–b1) sensitivity and specificity for the system, (a2–b2) sensitivity and specificity for the expert. These plots demonstrate similarity in the numbering patterns produced by the system and the expert.

