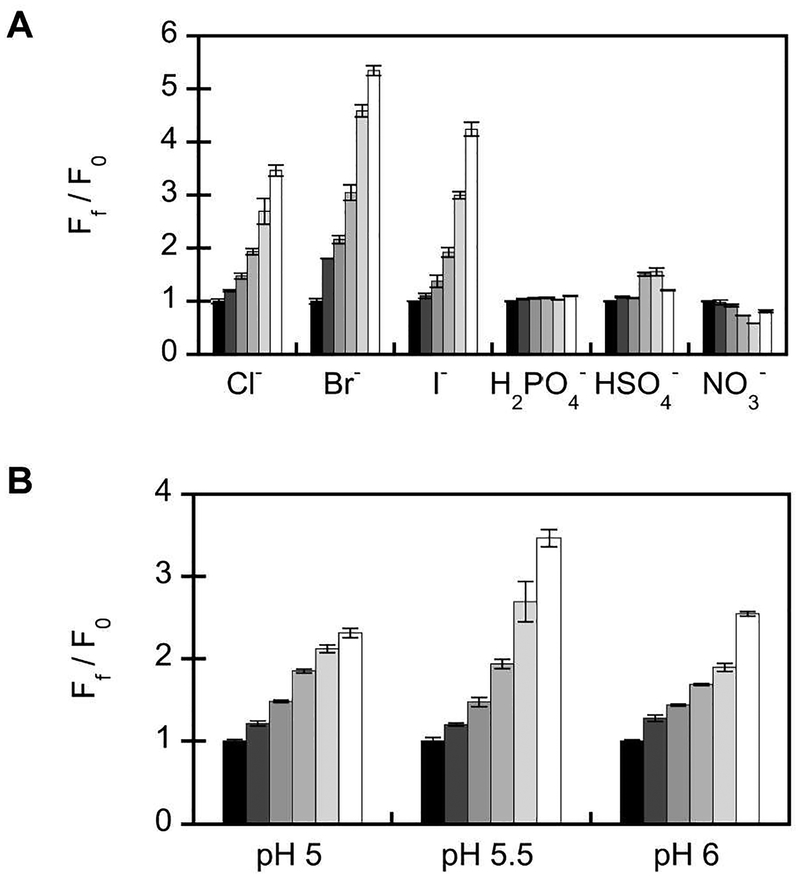
Figure 3.
Anion selectivity and pH profile of wild-type phiYFP (5 μM). (A) Emission response to 0, (F0, black bar), 25, 50, 100, 200, and 400 mM (white bar) chloride, bromide, iodide, dihydrogen phosphate, hydrogen sulfate, and nitrate. Spectra were acquired in 50 mM MES, pH 5.5 with λex = 400 nm. (B) Emission response to 0, (F0, black bar), 25, 50, 100, 200, and 400 mM (white bar) chloride. Spectra were acquired in 50 mM citrate, pH 5 (black bars), 50 mM MES, pH 5.5, and 50 mM MES, pH 6 with λex = 400 nm. The average of three technical replicates with standard error of the mean is reported. The sodium salt was used for all of the anions tested.

