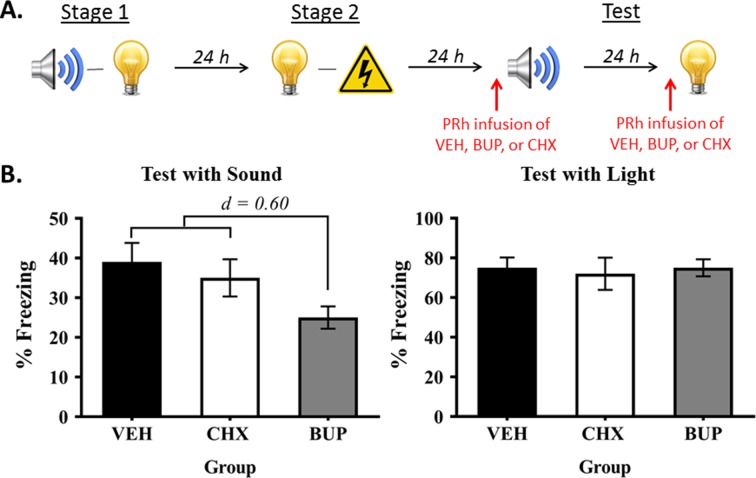
Figure 5. Neuronal activity in the PRh is required for expression of fear to the preconditioned sound, but not the conditioned light.
(A) Schematic of the procedure for Experiment 5 (Group VEH, n = 10; Group CHX, n = 7; and Group BUP, n = 7). The red arrows indicate that infusions occurred before the test for the sensory preconditioned sound and before the test for the conditioned light. (B) Percentage freezing to the preconditioned sound (left panel) and to the conditioned light (right panel), averaged across the eight trials of their respective tests. Data shown are means ± SEM. The levels of freezing in both tests were analyzed using a set of planned orthogonal contrasts (Hays, 1963). The first contrast compared Group BUP versus the weighted average of Groups VEH and CHX (both of which were expected to show fear); and the second contrast compared Group VEH versus Group CHX. Cohen’s d (d) is shown for statistically significant results. For raw data, see the Figure 5—source data 1.

