. 2019 Jun 13;8:e45631. doi: 10.7554/eLife.45631

Figure 2. Overexpression of Vps8 inhibits autolysosome formation in starved fat cells, similar to HOPS (vps39) RNAi.

(A) Overexpression of Vps8 in GFP+ fat cells impairs LysoTracker Red dot formation compared with neighboring non-GFP control cells, similarly to HOPS loss-of-function (Takáts et al., 2014). (B and C) Both Vps8 overexpression (B) and vps39 RNAi (C) impairs the proper formation of 3xmCherry-Atg8a+ autophagic vesicles in GFP+ cells: these red dots are bigger and brighter in surrounding control cells and GFP+ cells contain smaller and fainter dots (likely autophagosomes) in both cases. (D and E) The number of endogenous Atg8a puncta (autophagosomes) increases in GFP+ Vps8 overexpressing (D) or vps39 RNAi (E) cells compared to GFP-negative control cells. (A’–E’) Quantification of data from panels A–E. The median and the average are indicated as a horizontal black line and x within the boxes, respectively. Bars show the upper and lower quartiles, and significant differences are indicated. (F) Western blot from well-fed adult lysates shows the obvious accumulation of Ref(2)P/p62 and both unlipidated (I) and autophagosome-associated, lipidated (II) forms of Atg8a in animals systemically overexpressing Vps8.

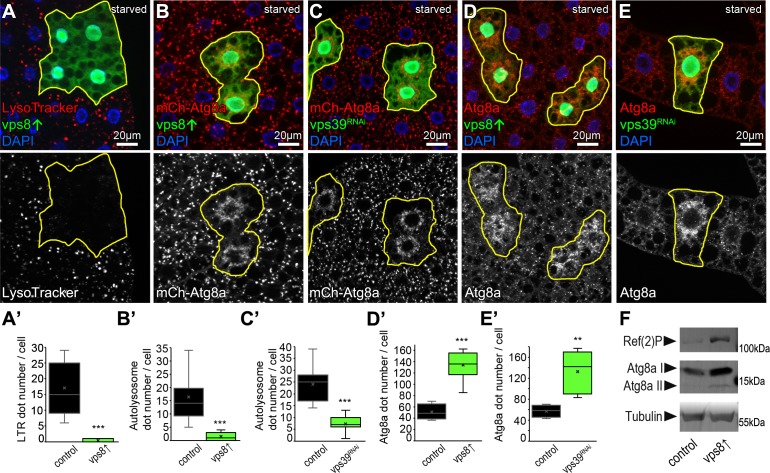
Figure 2.

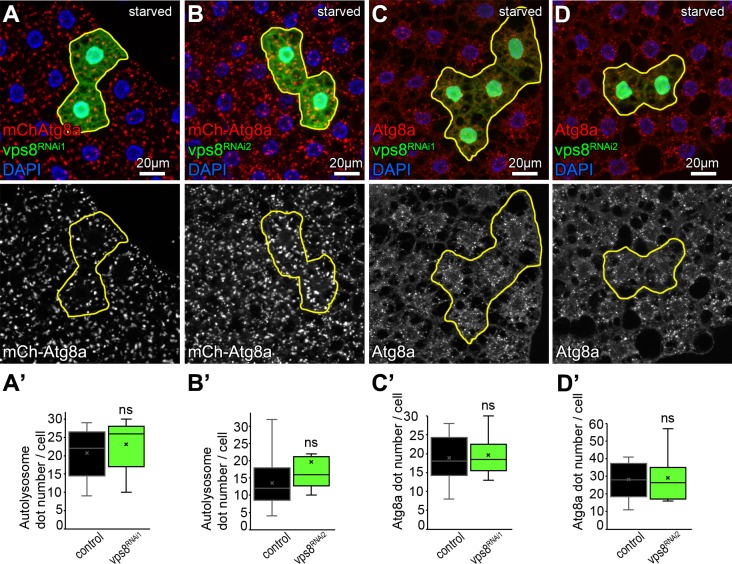
Figure 2—figure supplement 1. Vps8 (miniCORVET) is dispensable for autophagy in starved fat cells.

Figure 2—figure supplement 1.

The size and distribution of both 3xmCherry-Atg8a autophagic vesicles (A,B) and endogenous Atg8a labeled autophagosomes (C,D) in GFP-marked vps8 RNAi cells are similar to those in GFP-negative control cells. (A’–D’) Quantification of data from panels A–D. The median and the average are indicated as a horizontal black line and x within the boxes, respectively. Bars show the upper and lower quartiles, ns: not significant.
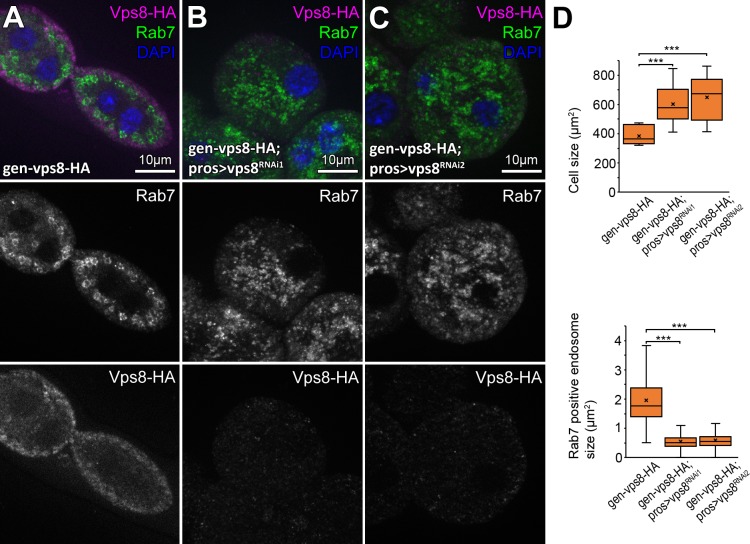
Figure 2—figure supplement 2. Validation of knockdown efficiencies for Vps8 RNAi lines used in this study.

Figure 2—figure supplement 2.

Compared to gen-Vps8-9xHA controls (A), vps8 RNAi nephrocytes (B,C, note that these are also on a gen-Vps8-9xHA background) are swollen and filled with small Rab7+ late endosomes. As expected, the HA signal disappears in RNAi cells, indicating efficient knock-down. (D) Quantification of data from panels A–C. The median and the average are indicated as a horizontal black line and x within the boxes, respectively. Bars show the upper and lower quartiles, ***: p<0.001.
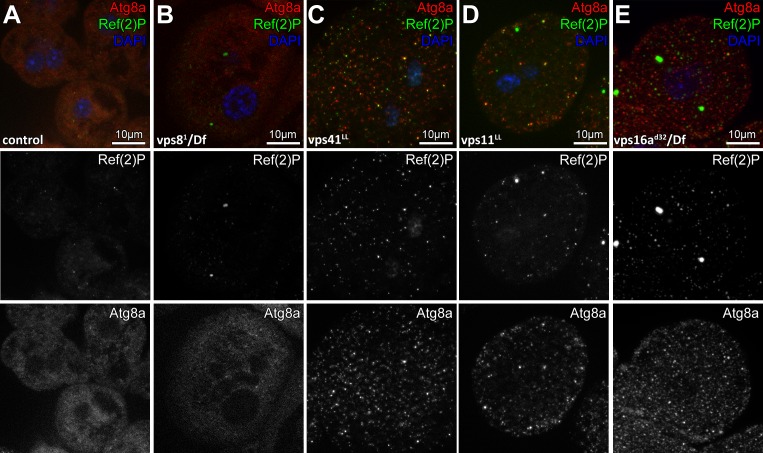
Figure 2—figure supplement 3. Analysis of basal autophagy in nephrocytes.

Figure 2—figure supplement 3.

(A–E) Anti-Atg8a and anti-Ref(2)P/p62 stainings visualize autophagosomes and protein aggregates, respectively. Very few structures positive for either Atg8a or Ref(2)P are seen in control (A) and vps8 null mutant (B) nephrocytes, unlike vps41 (C), vps11 (D) and vps16a (E) mutants, which all accumulate both Atg8a+ autophagosomes and Ref(2)p+ protein aggregates.