. 2019 Jun 13;8:e45631. doi: 10.7554/eLife.45631

Figure 7. The late endosomal recruitment of Vps41 requires Rab2 and Rab7 but not Arl8.

All images show nephrocytes expressing Vps41-9xHA on different genetic backgrounds, stained with anti-HA (magenta) and anti-Rab7 or YFP (green). (A) A subset of Rab7 endosomes are positive for Vps41-9xHA. (B) Vps41-9xHA is mostly dispersed throughout the cytoplasm in cells undergoing rab7 RNAi. Interestingly, occasional Vps41-9xHA rings are still observed (arrow). (C) The colocalization of Vps41-9xHA with Rab7 increases on enlarged endosomes in cells expressing the constitutively active mutant form of Rab7. (D) Knockdown of rab2 results in the swelling of nephrocytes that contain enlarged Rab7 endosomes with no Vps41-9xHA signal. (E) Vps41-9xHA is recruited to vesicles positive for GTP-locked Rab2. (F) The overlap of Vps41-9xHA with enlarged Rab7 vesicles decreases, but it is still obvious in cells undergoing arl8 RNAi. Averaged scatter plots (generated from 13 rab7 RNAi, 11 Rab-Q67L, 15 rab2 RNAi, 11 Rab2-Q65L and 12 arl8 RNAi cells) show the intensity correlation profiles of Vps41-9xHA (labeled with anti-HA) with Rab7 (B’, D’. (F’) or Rab7-Q67L (C’) or Rab2-Q65L (E’). Pearson correlation coefficient was not determined in B’ as no punctate Rab7 signal was detected. Pearson correlation coefficients shown at the top of panels A’, B’ and D’ indicate substantial colocalization, no overlap in panel C’, and still detectable colocalization in panel E’. Please note that since the experiments shown here and in Figure 6 were carried out in parallel, the same averaged plot and Pearson correlation coefficient value is shown for controls (A’) in both Figures.

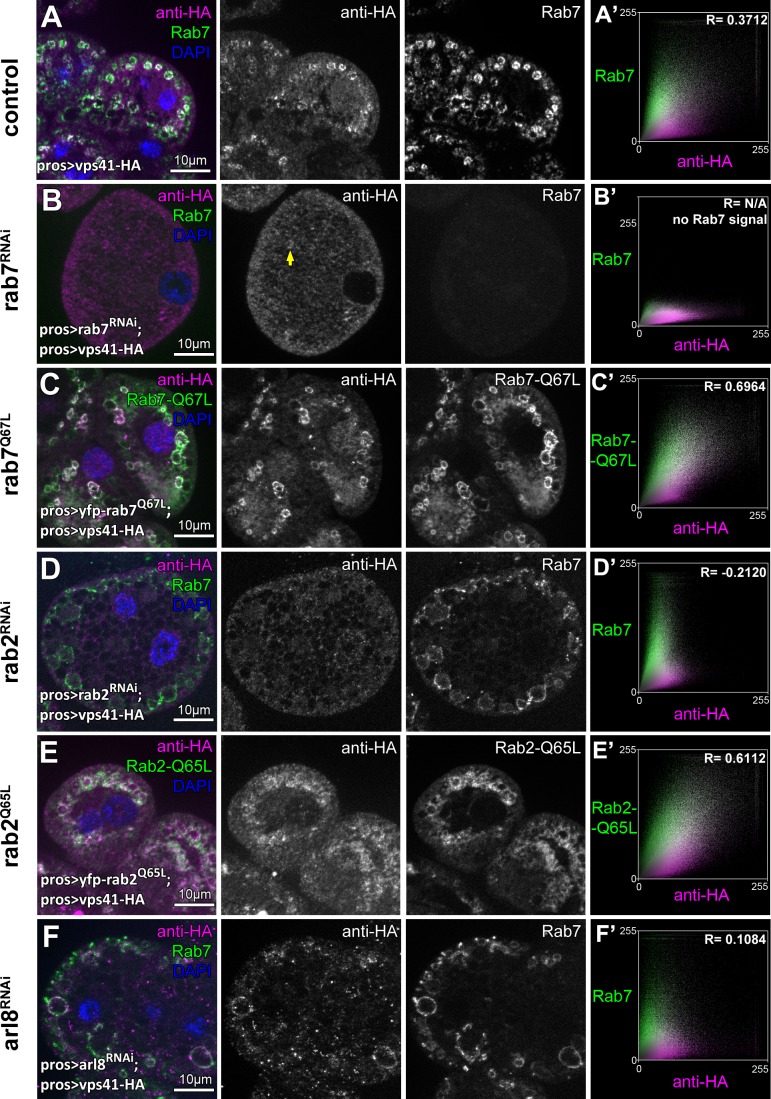
Figure 7.

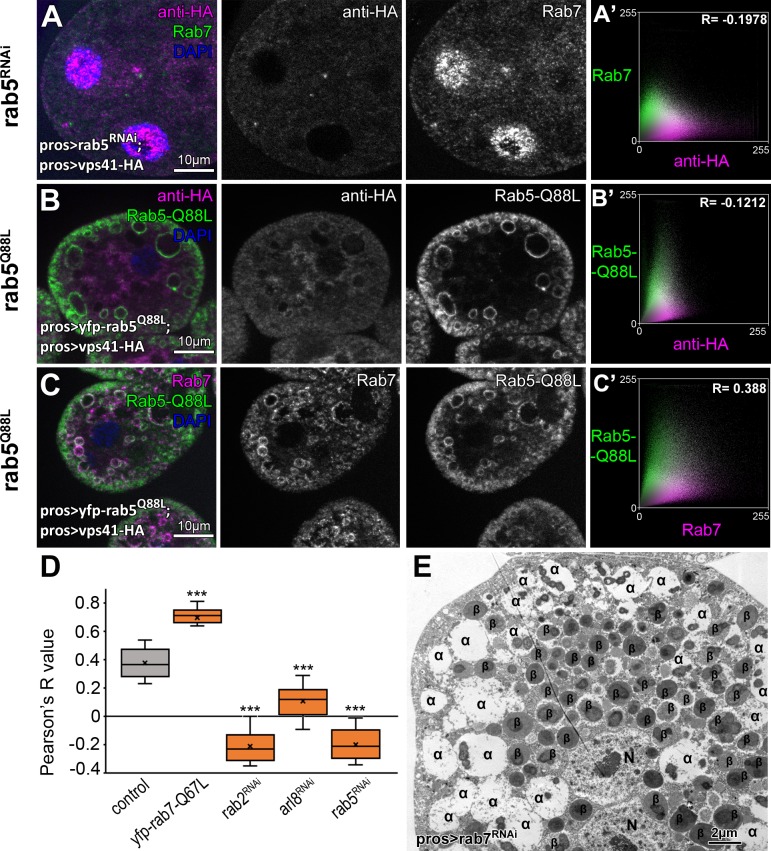
Figure 7—figure supplement 1. Additional Vps41-9xHA data.

Figure 7—figure supplement 1.

(A) Vps41-9xHA looses its endosomal localization in garland nephrocytes undergoing rab5 RNAi as these cells lack Rab7+ endosomes. Vps41-9xHA is dispersed throughout the cytoplasm in cells expressing GTP-locked Rab5-Q88L (B), even though some of these Rab5-Q88L positive rings are Rab7 positive (C), indicating the formation of hybrid early and late endosomes. (A’,B’) Averaged scatter plots (generated from 13 rab5 RNAi, and 17 Rab5-Q88L cells from) show the intensity correlation profile of Vps41-9xHA (labeled with anti-HA) with endogenous Rab7 (A’) or Rab5-Q88L (B). Pearson correlation coefficient shown at the top of panels A’ and B’ indicate no colocalization. C’ Averaged scatter plot (generated from 10 Rab5-Q88L cells from) shows the intensity correlation profile of Rab7 with Rab5-Q88L. Pearson correlation coefficient shown at the top of panel C’ indicate substantial colocalization. (D) Quantification of Vps41-9xHA and Rab7 colocalization data from panel A and from Figure 7A,C,D,F. The median and the average of the measured Pearson correlation coefficients are indicated as a horizontal black line and x within the boxes, respectively. Bars show the upper and lower quartiles, and significant differences are indicated in panels. ***: p<0.001 (E) Ultrastructural analysis of nephrocytes undergoing rab7 RNAi revealed the presence of enlarged late endosomes (α-vacuoles – indicated by α in the panels) and aberrant lysosomes (β: β-vacuoles), please compare to data in Figure 1 panels F-I. N: nucleus.