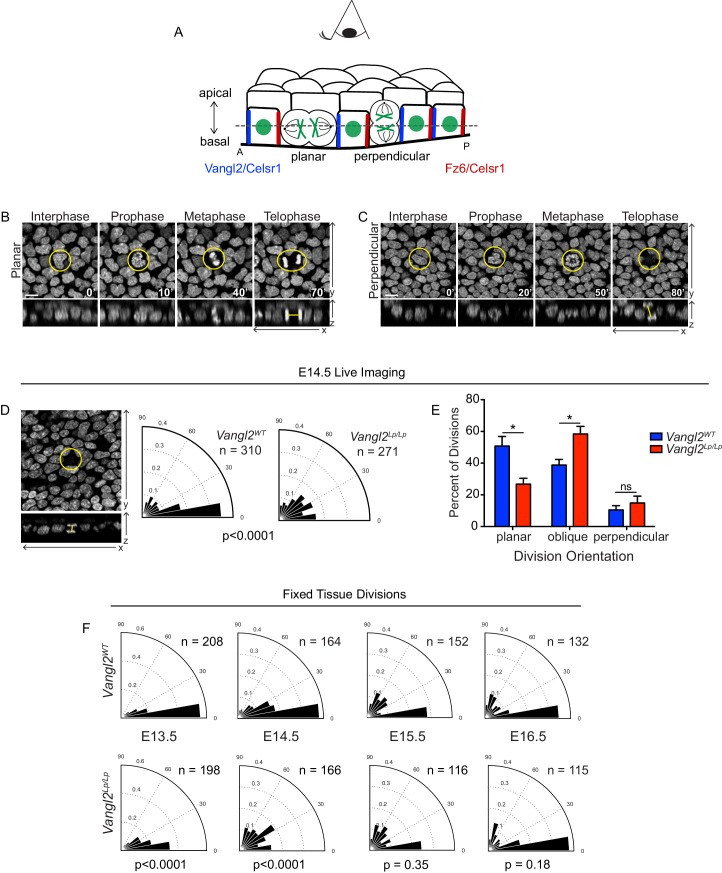
Figure 1. Basal cell division orientations in wildtype and Vangl2 mutant embryos.
(A) Schematic of E14.5 skin depicting several planar cell polarity components and example division orientations. Dotted line represents focal plane for live imaging. (B,C) Stills from time-lapse movies of Vangl2WT E14.5 skin explants expressing K14-H2B-GFP, showing examples of planar (B) and perpendicular (C) division orientations. Top panels are the planar view of the basal layer of the epidermis, bottom panels are XZ dimension. Scale bar = 10 μm. See also Figure 1—video 1 and Figure 1—video 2. (D) Example and quantification of division angles in live epidermal explants at E14.5. Vangl2WT, n = 310 divisions pooled from three embryos. Vangl2Lp/Lp, n = 271 divisions from three embryos. Modified Kuiper’s Test, p=1.7523e-15. (E) Distribution of division orientations in live epidermal explants at E14.5. Planar: Θ <= 20°, unpaired two-tailed t-test p=0.027; oblique: 20°>Θ>=70°, p=0.030; perpendicular: 70°>Θ>=90°, p=0.427. n = 3 explants from each genotype. (F) Angular frequency of division angles quantified from fixed whole mount skins dissected from embryos e13.5 – e16.5. E13.5: Vangl2WT, n = 208 divisions from three embryos; Vangl2Lp/Lp, n = 198 divisions from two embryos; p=2.8648e-08. E14.5: Vangl2WT, n = 164 divisions from three embryos; Vangl2Lp/Lp, n = 166 divisions from three embryos; p=1.5118e-18. E15.5: Vangl2WT, n = 152 divisions from three embryos; Vangl2Lp/Lp, n = 116 divisions from three embryos; p=0.3482. E16.5: Vangl2WT, n = 132 divisions from three embryos; Vangl2Lp/Lp, n = 115 divisions from three embryos; p=0.1785.

