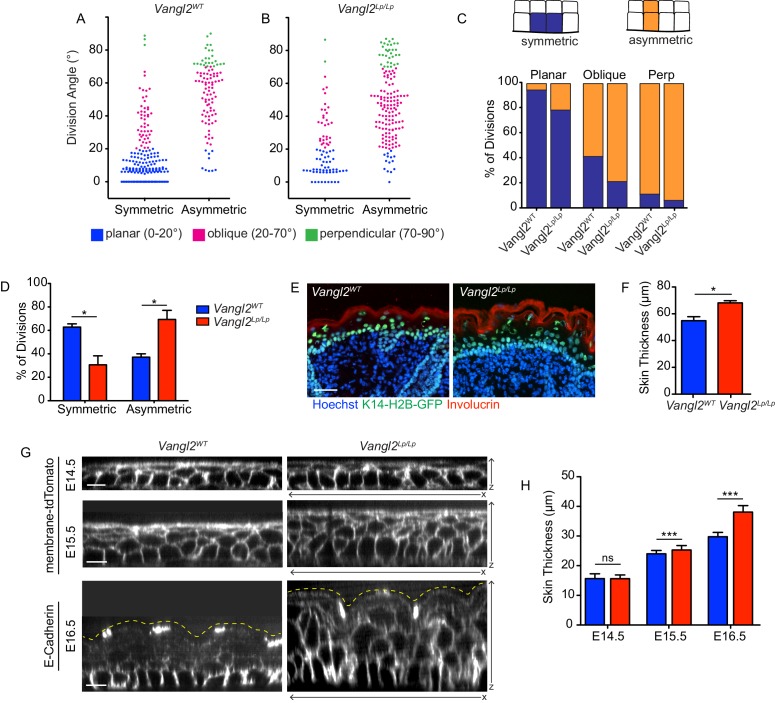
Figure 2. Positional cell fates correlate with division orientation.
(A, B) The relationship between division angle and final cell positions. Daughter cells were followed for 1.5 hr after cell division, and assigned a positional fate: symmetric or asymmetric. Each dot represents a single division event. (C) Representation of the same data in (A,B), showing the distribution of fates for each division orientation. For planar divisions: symmetric fates = 94% [Vangl2WT], 78% [Vangl2Lp/Lp]. Oblique divisions: symmetric fates = 41% [Vangl2WT], 21% [Vangl2Lp/Lp]. Perpendicular divisions: asymmetric fates = 89% [Vangl2WT], 94% [Vangl2Lp/Lp]. (D) Combining all division orientations, Vangl2Lp/Lp embryos display an overall bias toward asymmetric final cell positions. Unpaired two-tailed t-test, p=0.017. For (A–D), n = 284 divisions pooled across three Vangl2WT embryos; n = 238 divisions pooled from three Vangl2Lp/Lp embryos. (E) Sagittal sections of E18.5 skin from Vangl2WT; K14-H2B-GFP and Vangl2Lp/Lp; K14-H2B-GFP embryos. Involucrin (red) labels the outer stratified layers and nuclei are labeled with Hoechst. Scale bar = 50 μm. (F) Quantification of skin thickness at E18.5. n = 10 images for each of three embryos per genotype. Bars represent means of the three embryos, error bars are SEM. Unpaired two-tailed t-test, p=0.017. (G) XZ panels from whole mount images of Vangl2WT and Vangl2 mutant skins at E14.5 – E16.5, expressing membrane-tdTomato or immunostained for E-Cadherin. Yellow dotted lines outline the outermost epidermal layer. Scale bars = 10 μm. (H) Quantification of skin thickness at E14.5 – E16.5. n = 30 measurements per genotype per stage. Bars represent means, error bars are SD. E14.5: unpaired two-tailed t-test, p=0.9340; E15.5: unpaired two-tailed t-test, p=0.0003; E16.5: unpaired two-tailed t-test, p<0.0001.

