. 2019 Jun 12;8:e47102. doi: 10.7554/eLife.47102

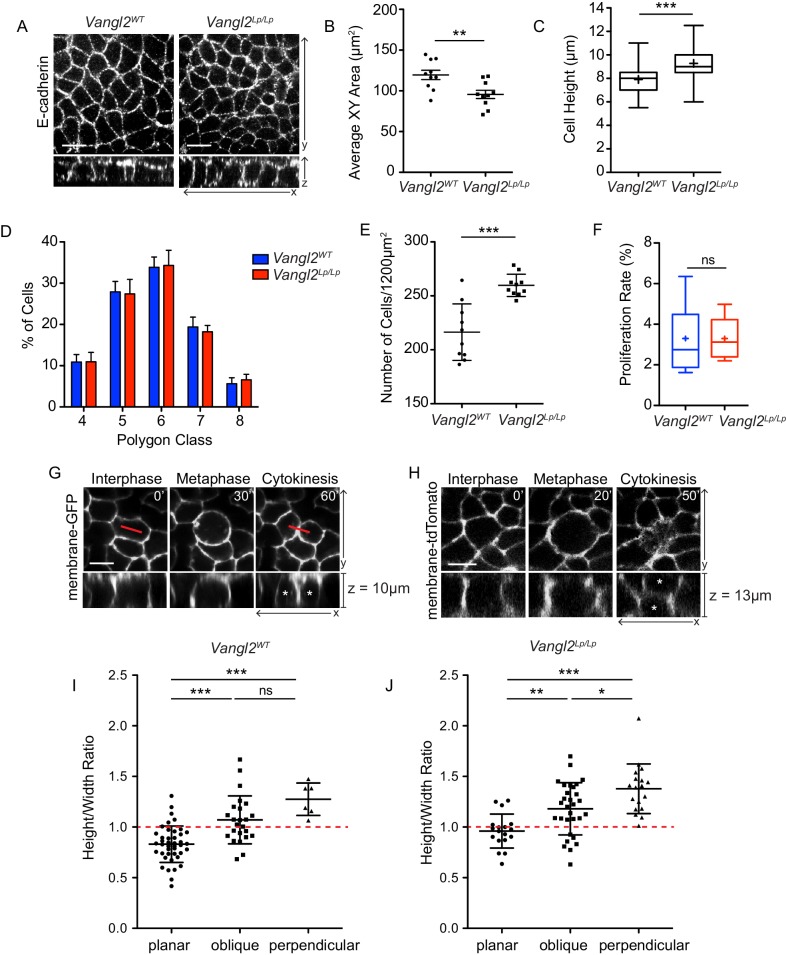
Figure 4. Cell division orientation correlates with basal cell geometry.

(A) Representative images of basal layer labeled with E-Cadherin from E14.5 Vangl2WT and Vangl2Lp/Lp embryos. (B) Quantification of cross sectional areas of basal cells. Each dot represents average area of all cells in a single field of view. n = 10 total fields of view from three embryos per genotype. Bars are mean with SEM. Unpaired two-tailed t-test, p=0.0057 (C) Quantification of cell height along apical-basal axis. 300 cells were measured from across three embryos per genotype. Whiskers indicate minimum and maximum values, + indicates the mean. Unpaired two-tailed t-test, p<0.0001. (D) Quantification of distribution of polygon classes, as defined by the number of each cell’s neighbors. n = 10 total fields of view from three embryos per genotype. Error bars denote SD. (E) Quantification of cell density, as number of cells per field of view (1200 μm2). Each dot represents a single field of view. n = 10 fields of view across three embryos per genotype. Bars are mean with SD. Unpaired two-tailed t-test, p=0.0001. (F) Proliferation rates, quantified as the number of mitotic cells in a field of view as a percentage of total number of cells. n = 10 fields of view across three embryos. Whiskers denote min-max values, mean shown as ‘+.’ Unpaired two-tailed t-test, p=0.9987. (G) Still images from a time-lapse movie of E14.5 Vangl2WT; K14-Cre; mTmG explant showing an example of a basal cell dividing within the plane of the epidermis, along its longest interphase axis. Red line denotes orientation of the longest XY axis of the cell. See also Figure 4—video 1. (H) Still images from a time-lapse movie of an E14.5 skin explant from Vangl2ΔTm/Lp; mTmG embryo showing a cell dividing in a perpendicular orientation. Daughter cells are marked with asterisks in the XZ view. See also Figure 4—video 2. (I,J) Relationship between height:width aspect ratio and division orientation. H:W ratios were measured from interphase cells at the time just before the onset of mitotic rounding. Width is defined as the longest planar axis of the cell. Each dot corresponds to a single division event, and divisions were binned according to the angle of the division plane in cytokinesis. Bars are mean with SD. (I) n = 72 divisions pooled from three E14.5 embryos. One-way ANOVA, p<0.0001. Tukey’s Multiple Comparison Test: planar vs oblique, p<0.05; planar vs perpendicular, p<0.05; oblique vs perpendicular, p>0.05. (J) n = 66 divisions from two E14.5 Vangl2ΔTm/Lp embryos. One-way ANOVA, p<0.0001. Tukey’s Multiple Comparison Test: planar vs oblique, p<0.05; planar vs perpendicular, p<0.05; oblique vs perpendicular, p<0.05. All scale bars = 10 μm.

Figure 4.

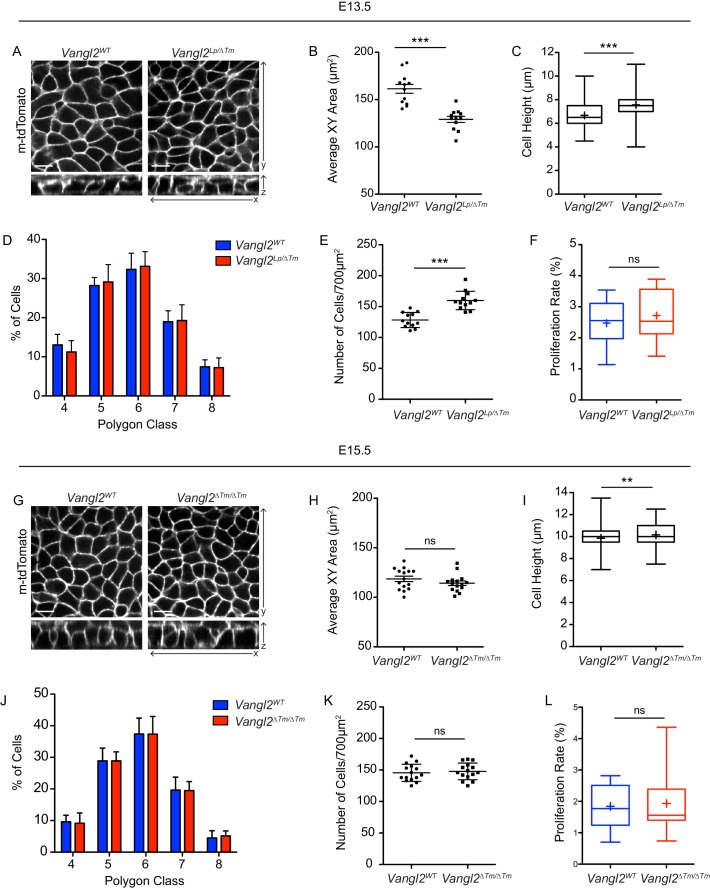
Figure 4—figure supplement 1. Characterization of epidermal cell shape and denisty at E13.5 and E15.5.

Figure 4—figure supplement 1.

(A) Representative images of basal layer labeled with membrane-tdTomato from E13.5 Vangl2WT and Vangl2Lp/ΔTm embryos. (B) Quantification of cross sectional areas of basal cells. Each dot represents average area of all cells in a single field of view. n = 12 total fields of view from three Vangl2WT embryos and two Vangl2Lp/ΔTm embryos. Bars are mean with SEM. Unpaired two-tailed t-test, p<0.0001. (C) Quantification of cell height along apical-basal axis. n = 300 cells from across three Vangl2WT embryos and two Vangl2Lp/ΔTm embryos. Whiskers indicate minimum and maximum values, + indicates the mean. Unpaired two-tailed t-test, p<0.0001. (D) Quantification of distribution of polygon classes, as defined by the number of each cell’s neighbors. n = 12 fields of view per genotype. Error bars denote SD. (E) Quantification of cell density, as number of cells per field of view (700 μm2). Each dot represents a single field of view. n = 12 fields of view per genotype. Bars are mean with SD. Unpaired two-tailed t-test, p<0.0001. (F) Proliferation rates, quantified as the number of mitotic cells in a field of view as a percentage of total number of cells. n = 12 fields of view per genotype. Whiskers denote min-max values, mean shown as ‘+.’ Unpaired two-tailed t-test, p=0.4416. (G) Representative images of basal layer labeled with membrane-tdTomato from E15.5 Vangl2WT and Vangl2ΔTm/ΔTm embryos. (H) Quantification of cross sectional areas of basal cells. Each dot represents average area of all cells in a single field of view. n = 15 total fields of view from three embryos per genotype. Bars are mean with SEM. Unpaired two-tailed t-test, p=0.2314. (I) Quantification of cell height along apical-basal axis. n = 300 cells from across three embryos per genotype. Whiskers indicate minimum and maximum values, + indicates the mean. Unpaired two-tailed t-test, p<0.0001. (J) Quantification of distribution of polygon classes, as defined by the number of each cell’s neighbors. n = 15 fields of view per genotype. Error bars denote SD. (K) Quantification of cell density, as number of cells per field of view (700 μm2). Each dot represents a single field of view. n = 15 fields of view per genotype. Bars are mean with SD. Unpaired two-tailed t-test, p=0.6472. (L) Proliferation rates, quantified as the number of mitotic cells in a field of view as a percentage of total number of cells. n = 15 fields of view per genotype. Whiskers denote min-max values, mean shown as ‘+.’ Unpaired two-tailed t-test, p=0.7641. All scale bars = 10 μm.
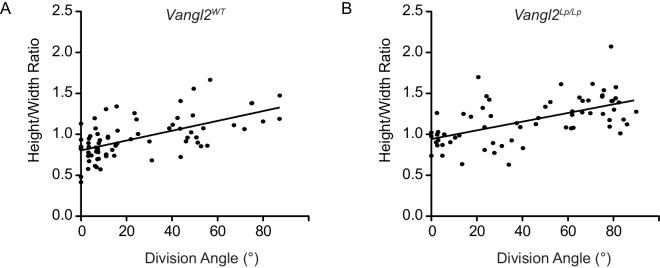
Figure 4—figure supplement 2. Correlation between division angle and height:width ratio.

Figure 4—figure supplement 2.

(A) Relationship between division angle and height:width ratio in E14.5 Vangl2WT skin explants. Slope = 0.006090 ± 0.0009291; R2 = 0.3803. Pearson’s correlation coefficient R = 0.62. (B) Relationship between division angle and height:width ratio in E14.5 Vangl2Lp/ΔTm skin explants. Slope = 0.005308 ± 0.0009498; R2 = 0.3280. Pearson’s correlation coefficient R = 0.57.
Figure 4—video 1. Planar view of a basal cell from an E14.5 Vangl2WT skin explant expressing membrane-GFP, undergoing a planar cell division along its longest interphase axis.
Download video file (89.4KB, mp4)
DOI: 10.7554/eLife.47102.011
The height:width aspect ratio of the dividing cell = 0.8.
Figure 4—video 2. Planar view of a basal cell from an E14.5 Vangl2ΔTm/Lp skin explant expressing membrane-tdTomato, undergoing a perpendicular cell division.
Download video file (202.9KB, mp4)
DOI: 10.7554/eLife.47102.012
The dividing basal cell is elongated along its apical-basal axis. Height:width aspect ratio of the dividing cell = 1.38.