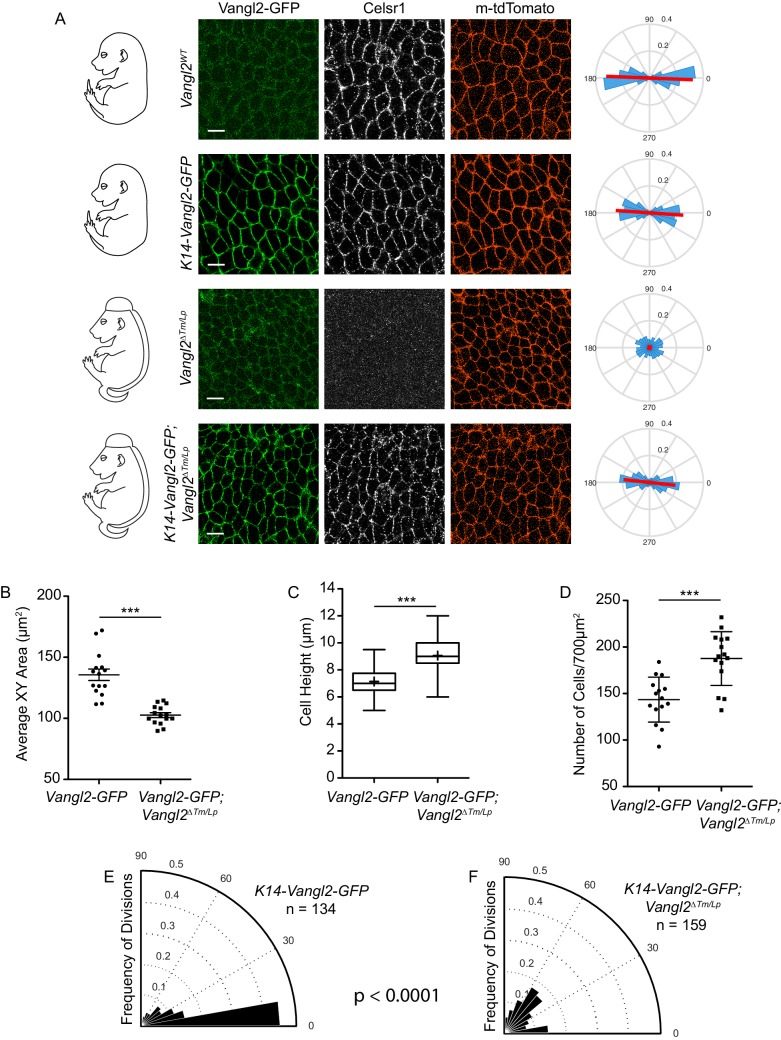
Figure 6. Cell shape and division orientation defects in Vangl2 mutants are indirect, and likely a consequence of failed neural tube closure.
(A) Representative images of the basal layer of Vangl2WT and Vangl2ΔTm/Lp embryos with or without K14-Vangl2-GFP. Green = 488 channel, Greyscale = Celsr1, Red = membrane tdTomato. Rose plots quantify Celsr1 polarity in the basal layer. Red line indicates the average magnitude and direction of polarity. Rose plots were generated from three images per genotype. All scale bars = 10 μm. (B) Quantification of cell surface areas. Each dot represents average surface area of all cells in a single field of view. n = 15 fields of view across three embryos per genotype. Bars are mean with SEM. Unpaired two-tailed t-test, p<0.0001. (C) Quantification of cell height along apical-basal axis. n = 300 cells per genotype. Whiskers indicate minimum and maximum values, + indicates the mean. Unpaired two-tailed t-test, p<0.0001. (D) Quantification of cell density, as number of cells per field of view (700 μm2). Each dot represents a single field of view. n = 15 fields of view across three embryos per genotype. Bars are mean with SD. Unpaired two-tailed t-test, p<0.0001. (E) Division orientations in Vangl2WT; K14-Vangl2-GFP embryos. n = 134 divisions, from 45 images across three embryos. (F) Division orientations in Vangl2ΔTm/Lp; K14-Vangl2-GFP embryos. n = 159 divisions, from 45 images across three embryos. Modified Kuiper Test, p=1.6201e-19.

