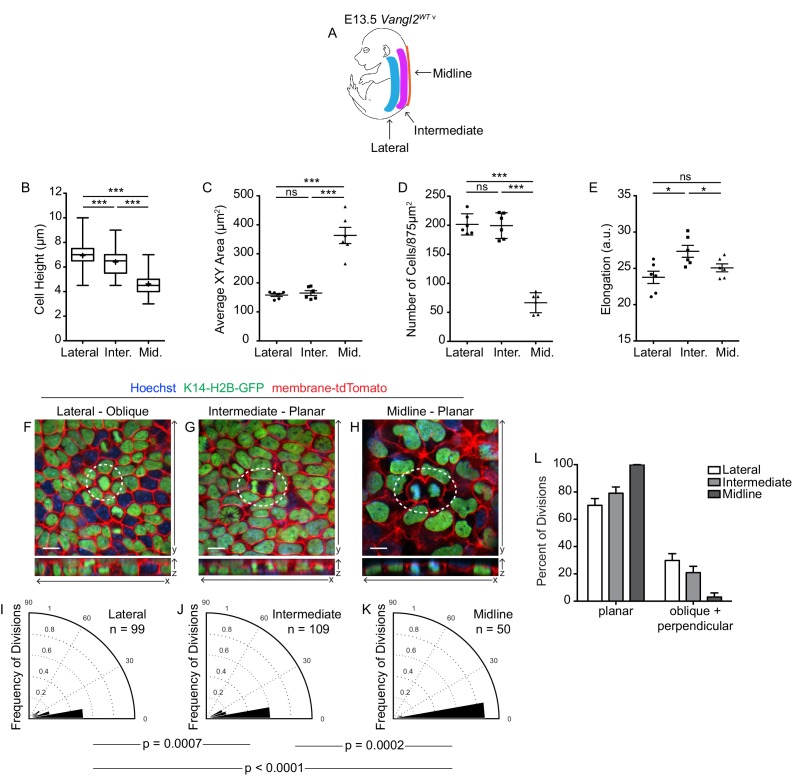
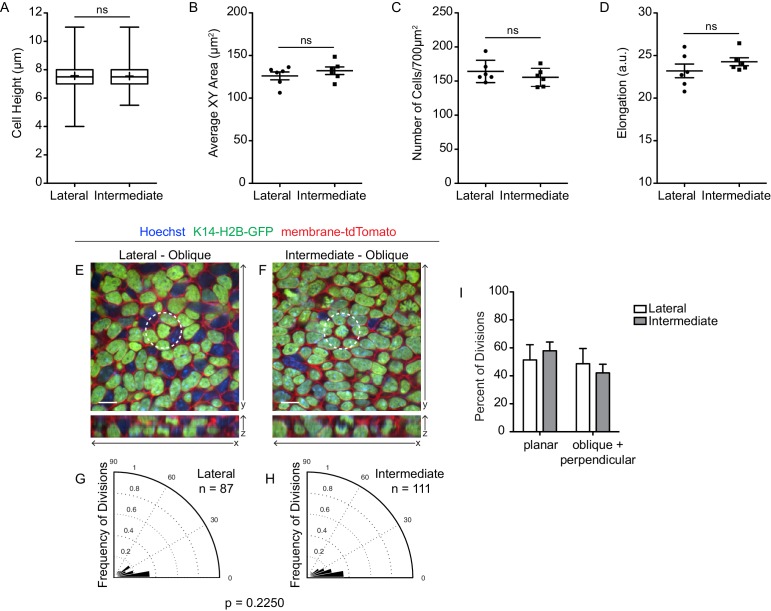
Figure 7. Spatial differences in cell geometries are associated with regional changes in division orientations.
(A) Schematic of an E13.5 Vangl2WT embryo, depicting the lateral, intermediate, and midline regions. (B) Quantification of cell height along apical-basal axis. n = 300 cells per genotype. Whiskers indicate minimum and maximum values, + indicates the mean. Lateral vs Intermediate, unpaired two-tailed t-test, p<0.0001; Lateral vs Midline, unpaired two-tailed t-test, p<0.0001; Intermediate vs Midline, unpaired two-tailed t-test, p<0.0001. (C) Quantification of basal cross-sectional areas. Each dot represents average surface area of all cells in a single field of view. Two images per region were analyzed, from each of three embryos, for a total of 6 measurements per region. Bars are mean with SEM. Lateral vs Intermediate, unpaired two-tailed t-test, p=0.4872; Lateral vs Midline, unpaired two-tailed t-test, p<0.0001; Intermediate vs Midline, unpaired two-tailed t-test, p<0.0001. (D) Quantification of cell elongations. Each dot represents the average elongation value of all cells in a field of view. Two images per region were analyzed, from each of three embryos, for a total of 6 measurements per region. Bars represent mean with SEM. Lateral vs Intermediate, unpaired two-tailed t-test, p=0.0125; Lateral vs Midline, unpaired two-tailed t-test, p=0.2256; Intermediate vs Midline, unpaired two-tailed t-test, p=0.0432. (E) Quantification of cell density, as number of cells per image (875 μm2). Each dot represents a single field of view. Two images per region were analyzed, from each of three embryos, for a total of 6 measurements per region. Bars represent mean with SD. Lateral vs Intermediate, unpaired two-tailed t-test, p=0.8567; Lateral vs Midline, unpaired two-tailed t-test, p<0.0001; Intermediate vs Midline, unpaired two-tailed t-test, p<0.0001. (F–H) Representative images of cell divisions in the lateral, intermediate, and midline regions in E13.5 Vangl2WT; K14-H2B-GFP embryos. Hoechst and membrane-tdTomato mark the nuclei and cell membranes, respectively. (I–K) Division orientations in the lateral, intermediate, and midline regions. Lateral: n = 99 divisions pooled from three embryos; Intermediate: n = 109 divisions pooled from three embryos; Midline: n = 50 divisions pooled from three embryos. Modified Kuiper’s Test: lateral vs intermediate, p=7.2638e-04; lateral vs midline, p=9.8559e-06; intermediate vs midline, p=1..5851e-04. (L) Distribution of planar vs oblique + perpendicular division orientations in the lateral, intermediate, and midline regions.


