
Figure 4. The constant of association Ka between monocytes and T cells (and T cell subsets) varies with the presence and nature of immune perturbations.
(A) Non-parametric spearman correlation between the frequency of T cell:monocyte complexes and the product of singlet T cells and monocyte frequencies in healthy subjects (n = 59). (B) Formula for the calculation of the T cell:monocyte constant of association Ka. T cell:monocyte complexes constant of association Ka in (C) active TB subjects at diagnosis and 2 months post treatment (n = 15), (D) individuals with acute dengue fever (n = 18), acute dengue hemorrhagic fever (n = 24) or previously infected (n = 47) and (E) previously vaccinated healthy adults (n = 16) before and three days post boost with Tdap vaccine, calculated as explained in B). (F) The constant of association Ka between monocytes and T cell subsets in active TB subjects at diagnosis (n = 25), individuals with acute dengue hemorrhagic fever (n = 24) and previously vaccinated healthy adults three days post boost with Tdap vaccine (n = 16), calculated as explained in B). Statistical differences over time and across cell populations within subjects were determined using the non-parametric paired Wilcoxon test; other statistical differences were determined using the non-parametric Mann-Whitney test; *, p<0.05; **, p<0.01; ***, p<0.01; ****, p<0.0001. Plots represent individual data points, median and interquartile range across all subjects within each cohort. Raw frequencies of T cell:monocyte complexes for the different disease cohorts are available on Figure 4—figure supplement 4. T cell:monocyte complexes were defined as the CD3+CD14+ cell population gated from live singlets as represented in Figure 1—figure supplement 2. CD4 and CD8 subsets within T cell:monocyte complexes were defined as presented in Figure 3E.

Figure 4—figure supplement 1. T cell:monocyte constant of association Ka in subjects with active TB, latent TB or TB uninfected individuals.
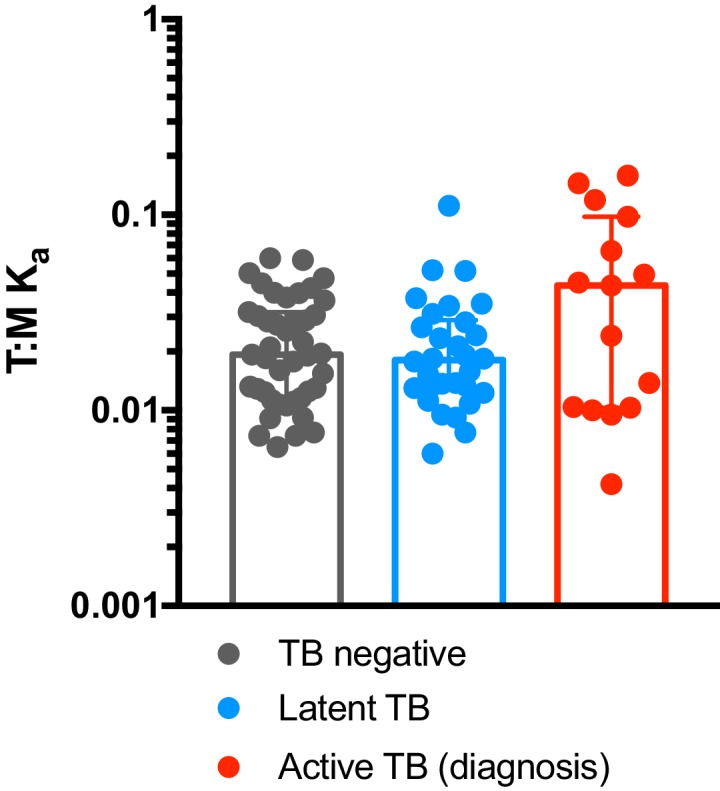
Figure 4—figure supplement 2. T cell:monocyte constant of association Ka fluctuates as a function of time following Tdap boost administration.
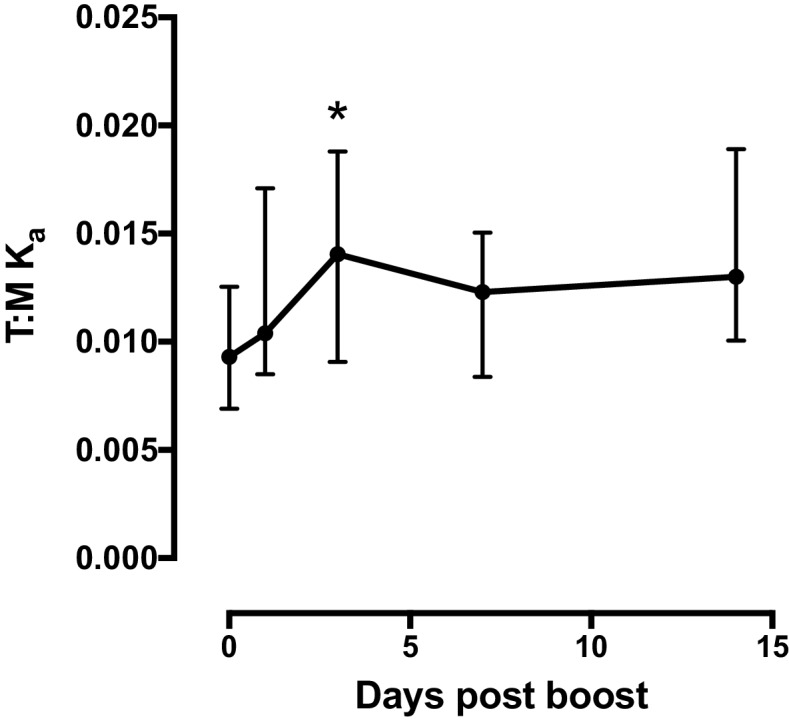
Figure 4—figure supplement 3. Comparison of constant of association Ka between monocytes and T cell subsets across different immune perturbations.

Figure 4—figure supplement 4. Frequencies of T cell:monocyte complexes in different immune perturbation models.
