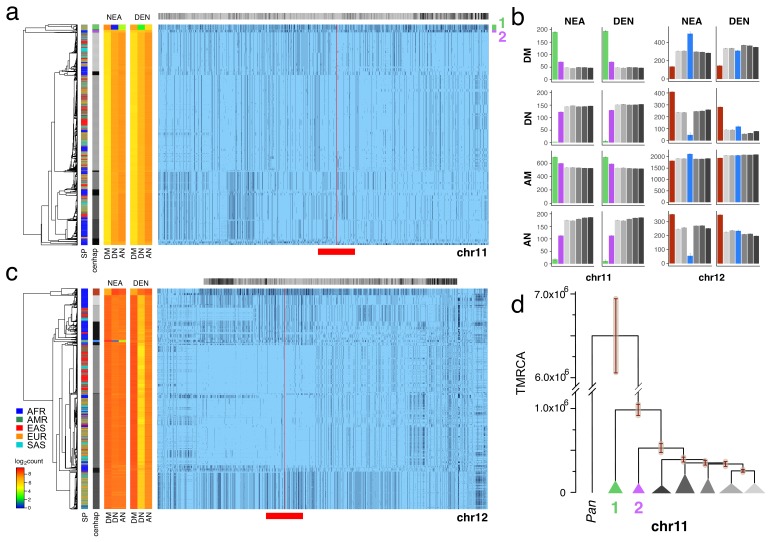
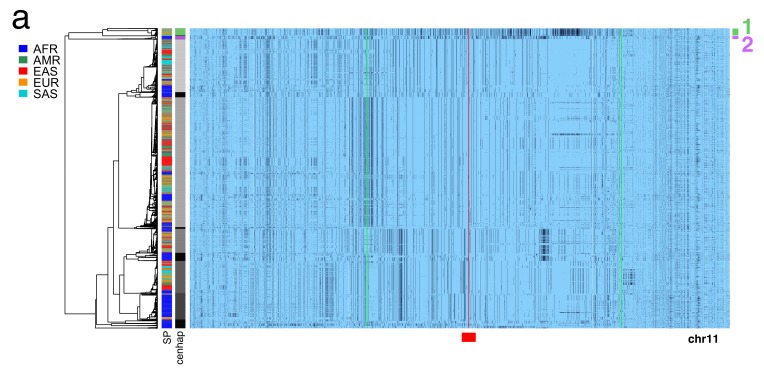
Figure 3. Archaic cenhaps are found in AMH populations.
A full resolution version of this figure is available as Figure 3—source data 3. (a) Haplotypic representation of 8816 SNPs from 5008 imputed chr11 genotypes from the 1000 Genomes Project (Left: chr11:50509493–51594084, Right: chr11:54697078–55326684; hg19). SNPs were filtered for MAC ≥ 35 and passing the 4gt_dco with a tolerance of three (see Materials and methods). Minor alleles shown in black and assembly gap indicated by red line. Haplotypes were clustered with UPGMA based on the hamming distance between haplotypes comprised of 1000 SNPs surrounding the gap (Left: chr11:51532172–51594084, Right: chr11:54697078–54845667; hg19, indicated by red bar at bottom). Superpopulation and cenhap partitioning are indicated by bars at far left. Log2 counts of DM (derived in archaic, shared by haplotype), DN (derived in archaic, not shared by haplotype) and AN (ancestral in archaic, not shared by haplotype) for each cenhap relative to Altai Neanderthal (NEA) and Denisovan (DEN) at left. Gray horizontal bar (top) indicates region included in analysis of archaic content; black bars indicate SNPs with data for archaic and ancestral states. (b) Bar plots indicating the mean and 95% confidence intervals of DM, DN, AM (ancestral in archaic, shared by cenhap) and AN counts for cenhap groups (as partitioned in a. and c.) relative to Altai Neanderthal and Denisovan genomes, using chimpanzee as an outgroup (Speidel et al., 2019). (c) Haplotypic representation, as above, of 21950 SNPs from 5008 imputed chr12 genotypes from the 1000 Genomes Project (Left: chr12:33939700–34856380, Right: chr12:37856765–39471374; hg19). SNPs were filtered for MAC ≥ 35. Haplotypes were clustered with UPGMA based on 1000 SNPs surrounding the gap (Left: chr12:34821738–34856670, Right: chr12:37856765–37923684; hg19). Bars at side, top and bottom same as in a. (d) A UPGMA tree based on the synonymous divergence for 30 genes in the seven major chr11 cenhaps (see Figure 3—source data 2), assuming the TMRCA of humans and chimpanzee is 6.5MY (see Materials and methods and legend for Figure 1d). The error bars at each node represent ±two standard deviations of distributions of estimated TMRCAs across the genes.


