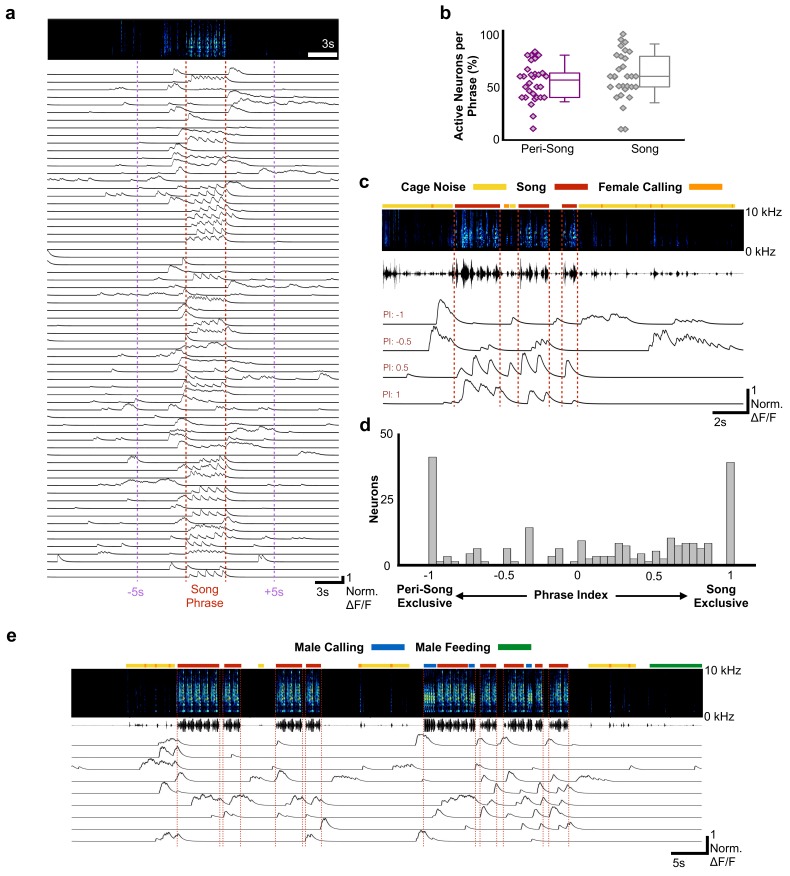
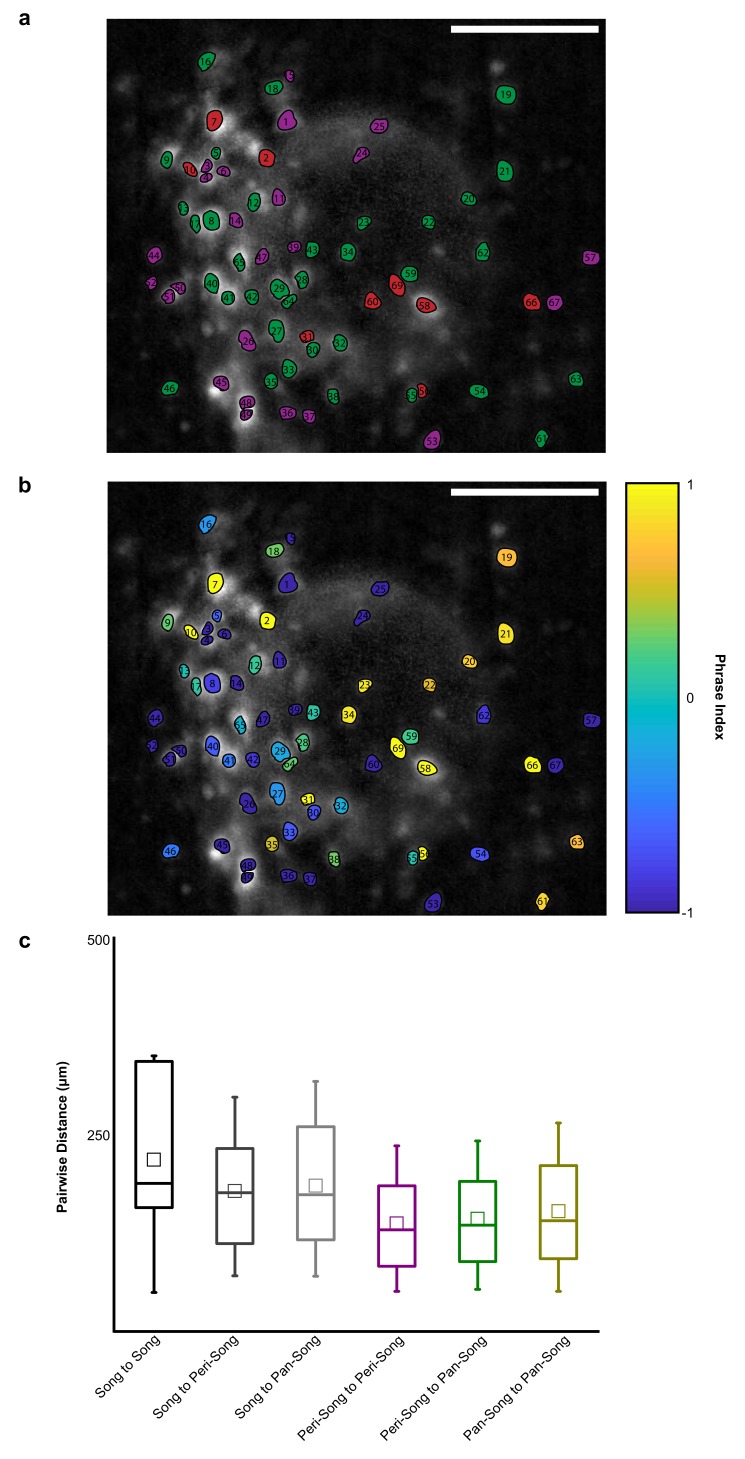
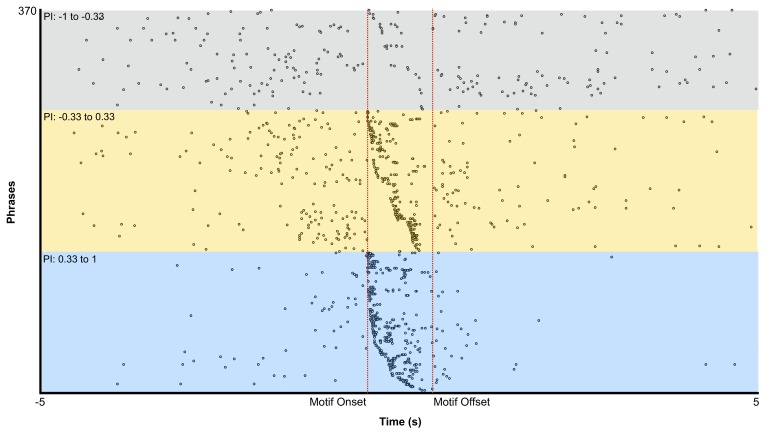
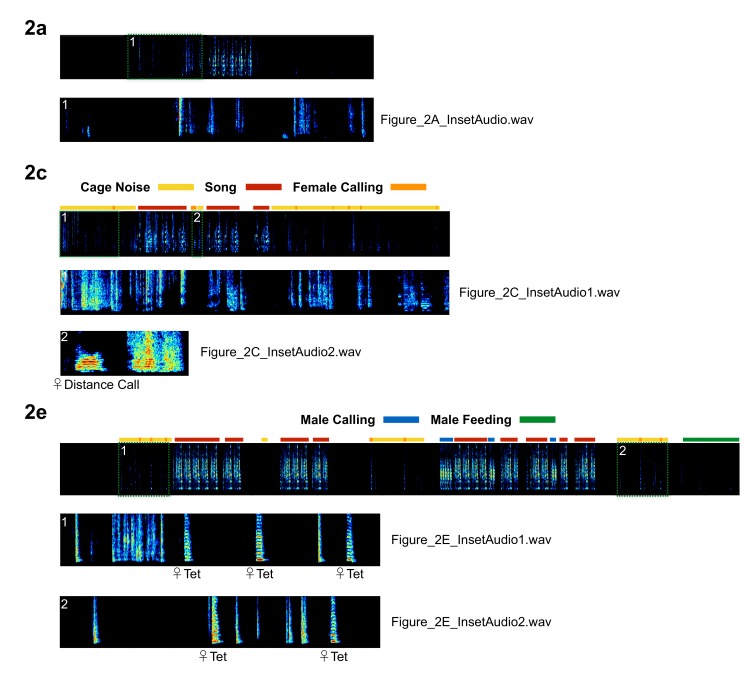
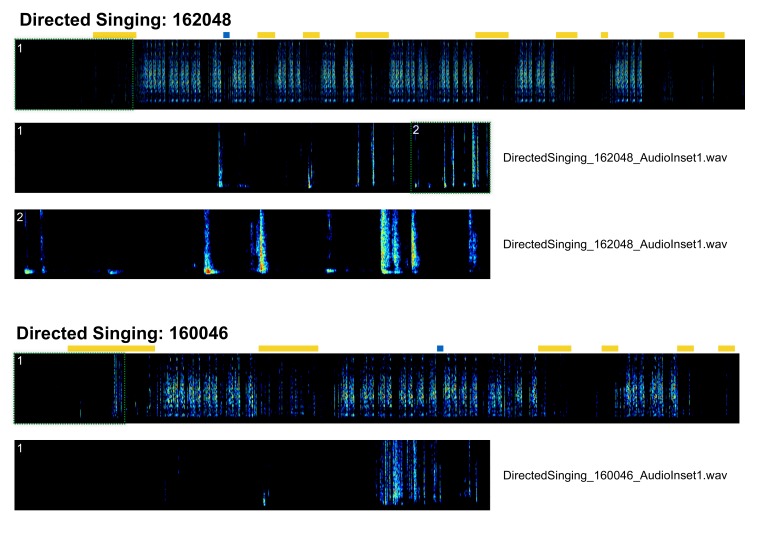
Figure 2. Most HVCRA neurons exhibit peri-song activity.
(a) Normalized calcium transients from 67 simultaneously recorded HVCRA neurons during production of a song phrase. The red dashed lines delimit five consecutive motifs. (b) Percentages of active neurons during peri-song (54.3 ± 17.8%, SD, purple) and song (59.9 ± 22.5%, gray) are similar (30 phrases, t = −1.1, p=0.29 paired two-sample t test). Box plots show the median, 25th and 75th percentiles with whiskers showing ±1.5 interquartile range (IQR). (c) Sample neurons with diverse phrase indices ranging from −1 to 1 and their corresponding calcium traces during 6 motifs over three bouts. Dashed lines indicate bout onsets and offsets. Bars above spectrogram indicate the presence of cage noise related to hopping and wing flapping (yellow) or female calling (FC, orange). (d) Histogram of phrase indices for all 223 neurons from six birds. (e) Undirected song from a different male showing periods of cage noise or hopping behavior (yellow) and feeding behavior (green). Blue boxes indicate the male calling. Red dashed lines indicate onsets and offsets of song bouts.

