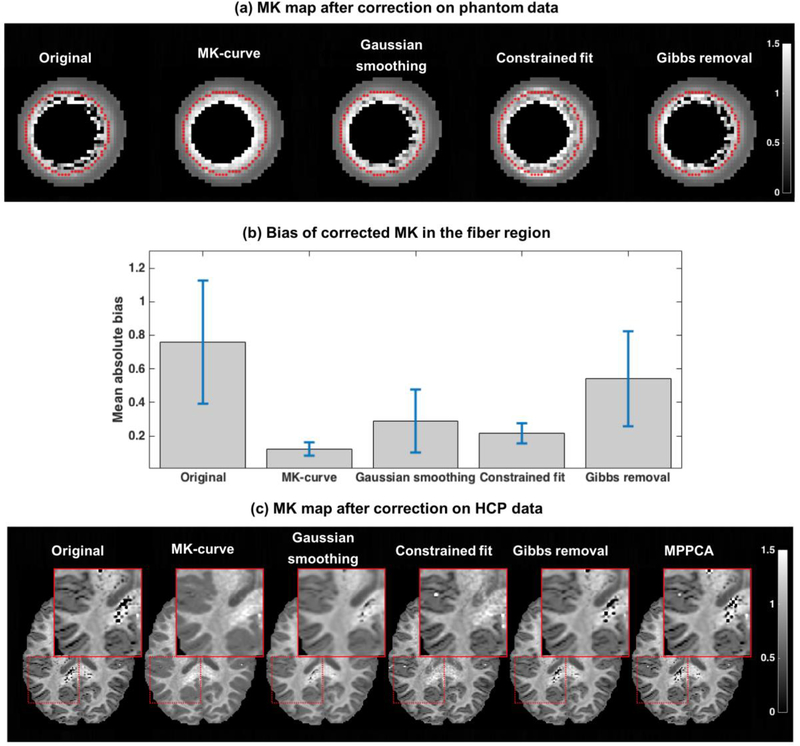
Figure 7: Comparison between correction methods.
The corrected MK map computed from the phantom data using each correction method is shown in (a), and the mean and std of the absolute bias after correction is reported in (b)(error bars in (b) represent std/3). The MK maps of one example HCP dataset is presented in (c) following application of the various correction methods. The inset focuses on deep white matter and on white matter/gray matter interface where most implausible MK values are located.

