
Figure 3.
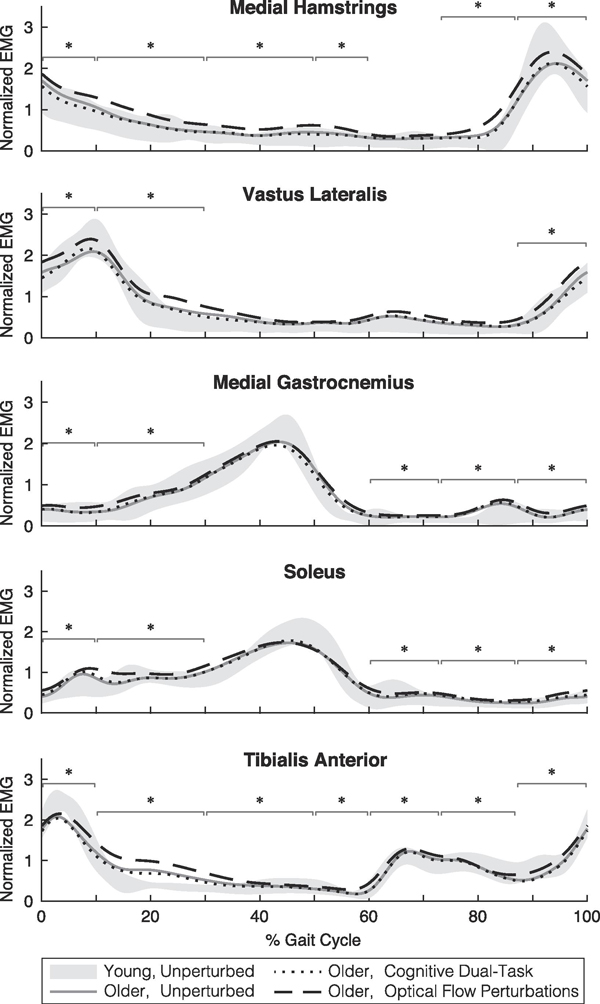
Mean electromyographic activity over the gait cycle for the young (shaded curve represents mean ± s.d.) and older adults. Each muscle’s activity level was normalized to its mean rectified activity during the unperturbed condition. Asterisks indicate phases of the gait cycle for the older adults where mean activity during the optical flow perturbation condition was significantly greater than the unperturbed condition.