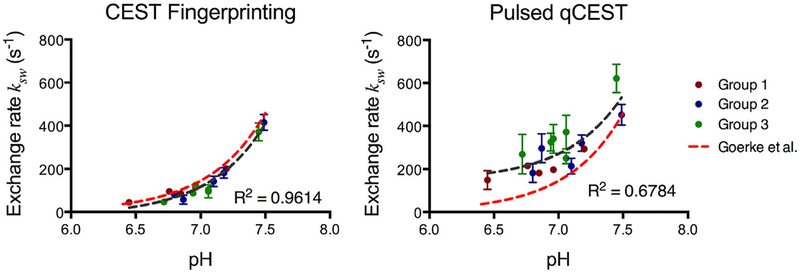
FIGURE 6.
Chemical exchange rate as a function of pH. The error bars represent the SD of the exchange rate within the region of interest of each tube. The dark gray dashed line represents the fitted curve of the exchange rate as a function of pH. The exchange rates reported by Goerke et al at 20°C shown in red dashed lines25 serve as the reference

