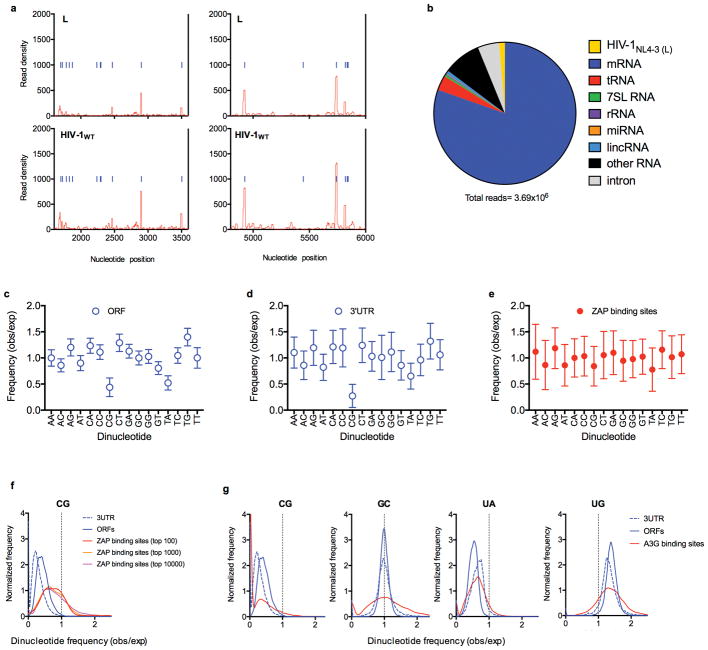
Extended data Figure 7. Dinucleotide composition of ORFs, 3′UTRs, and preferred ZAP binding sites in cellular mRNAs.
a, Expanded views of the portion of the CLIP graphs in Fig4. a corresponding to unmutated portions of the viral genome b, Sources of RNA reads bound to ZAP in a typical CLIP-seq experiment, done using HIV-1 infected cells c-e, Ratio of the observed frequency to the expected frequency (obs/exp, based on mononucleotide composition) for each of the 16 possible dinucleotides, in ORFs (c), 3′ UTR (d) sequences as well as the 100 sites in cellular mRNAs that were most frequently bound by ZAP, based on CLIP read numbers (e). Plotted values are mean ± sd of all ORF (n=35170) and 3′UTRs (n=135557) in the respective libraries (n=?) or the most preferred ZAP binding sites (n=100). f, Frequency distributions of CG dinucleotide observed/expected frequencies in human ORFs, 3′UTRs and top 100, top 1000 and top 10000 ZAP-binding sites in CLIP experiments. The top 100, top 1000 and top 10000 ZAP-binding sites account for 6.7%, 18.9% and 46.7% of total reads. g, Frequency distributions of CG, GC, UA and UG dinucleotide observed/expected frequencies in human ORFs, 3′UTRs and the top 100 APOBEC3G-binding sites in CLIP assays.

