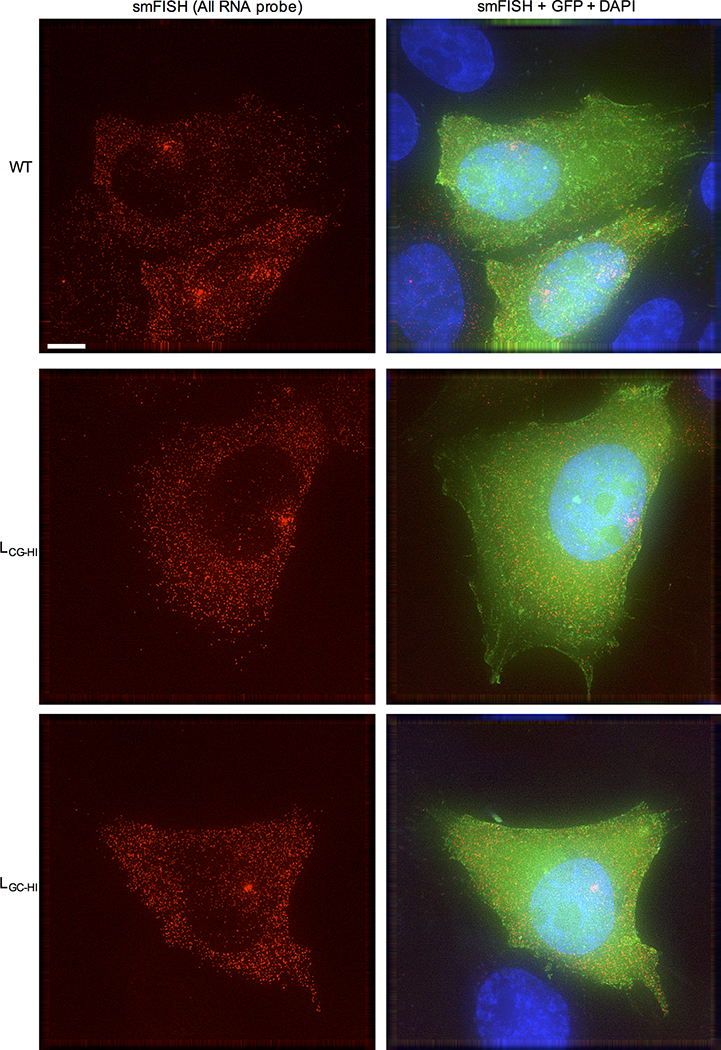
Extended data Figure 4. smFISH quantification of total HIV-1 RNA in infected cells.
Examples of smFISH analysis of WT and synonymous mutant HIV-1 infected cells (red=smFISH probe targeting all viral mRNA species (see Fig 2c), green=GFP, blue=Hoescht dye) Clusters of RNA molecules in the nuclei of some infected cells may represent sites of proviral integration. Representative of 3 independent experiments. Scale bar = 5μm.

