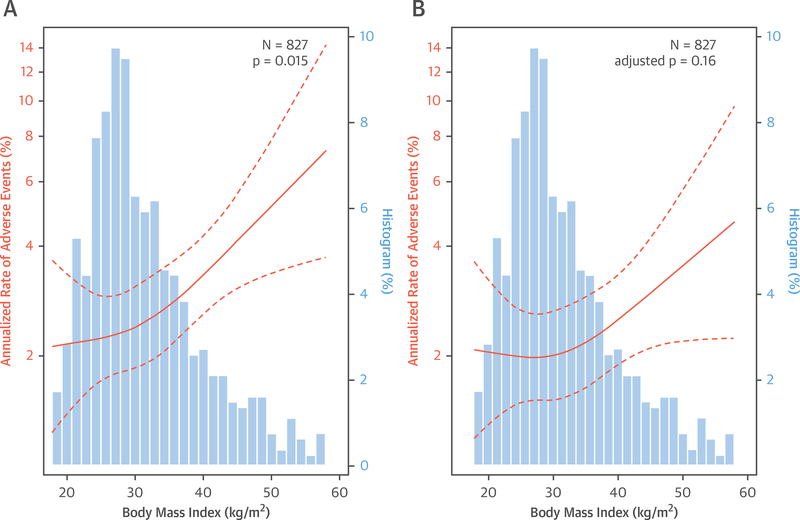
FIGURE 2. Relationship Between Body Mass Index and Annualized Rate of Adverse Events.
Relationship (A) adjusted for age only and (B) adjusted for demographic and clinical risk factors, including coronary flow reserve (also age, sex, race, hypertension, diabetes, peripheral vascular disease, chronic obstructive pulmonary disease, atrial fibrillation, tobacco use, estimated glomerular filtration rate, beta-blocker use and left ventricular ejection fraction). Restricted cubic spline Poisson regression models with 95% confidence intervals are shown in orange; patient frequency histograms appear in blue.

