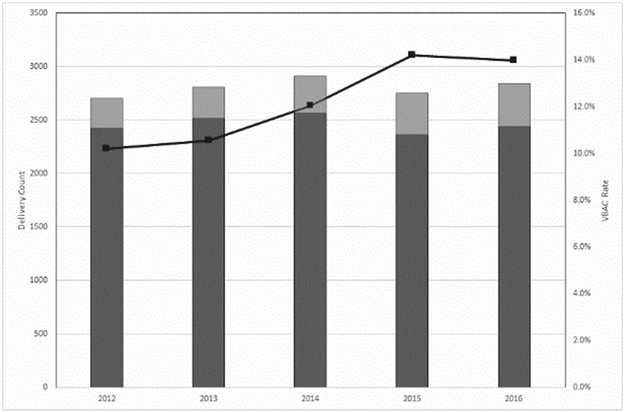
Figure 2. Rate of vaginal birth after cesarean (2012-2016).
Observed delivery counts are shown in bars on the primary axis with repeat cesarean in dark gray and VBAC in light gray. The observed VBAC rate is shown in the line on the secondary axis (black line). There was a significant increase in VBAC rate over time by linear regression (p=0.01).
VBAC, vaginal birth after cesarean

