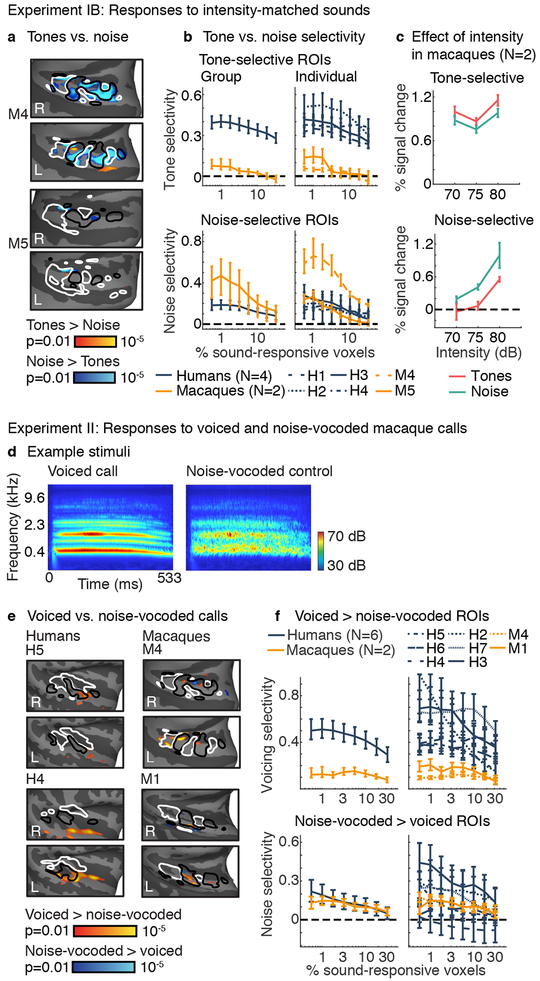
Fig 3. Control experiments.
a, Experiment IB. Maps of tone vs. noise responses averaged across frequency and three matched sound intensities (70, 75, and 80 dB) in two macaques. Conventions and statistics the same as Fig 1d (number of blocks per tone/noise condition: M4=1395, M5=1380). b, ROI analyses for the same tone vs. noise contrast. Human data from Experiment IA (with non-matched sound intensities) was used for comparison. Conventions and error bars the same as Fig 2f. c, ROI responses broken down by sound intensity for a fixed ROI size (top 1% of sound-driven voxels) (error bars the same as panel b / Fig 2f). d, Experiment II. Cochleagrams showing the stimulus conditions: voiced macaque vocalizations, containing harmonics, and noise-vocoded controls, which lack harmonics but have the same spectrotemporal envelope. e, Maps of responses to voiced vs. noise-vocoded macaque calls, in two humans (left) and two macaque monkeys (right). Maps plot uncorrected voxel-wise significance values (two-sided p < 0.01; Supplementary Fig 10 plots uncorrected and cluster-corrected maps from all subjects). Conventions and statistics the same as Fig 1d (number of blocks per condition being compared: M1=288, M4=414, H4=24, H5=22). f, ROI analyses for the same voiced vs. noise-vocoded contrast. Conventions and error bars the same as Fig 2f.

