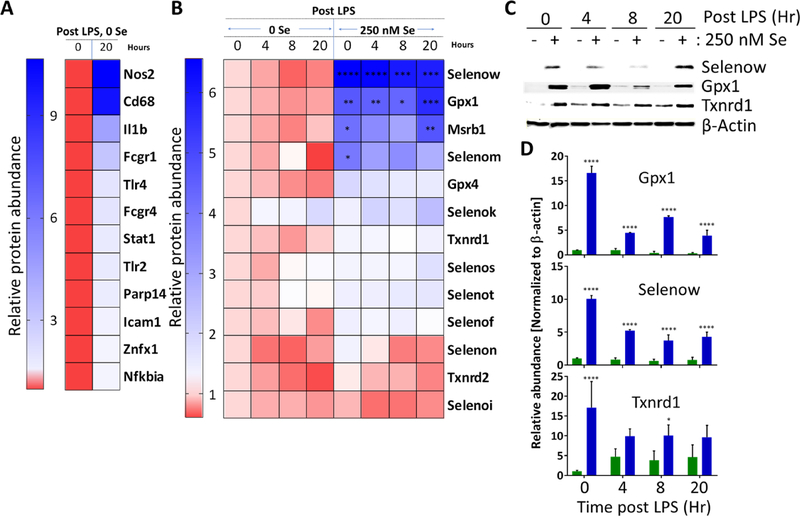
Figure 4.
Heat map for differentially regulated selenoproteins in macrophages post LPS treatment. Briefly, BMDMs were cultured with 100 ng/ml LPS for 20 hours. The samples were processed as described under “Methods”. Panel A shows upregulation of proto l proteins upregulated in response to LPS. Panel B shows temporal modulation of selenoproteins in macrophages. The color scale bar represents protein relative abundance, red (low) to blue (high). Panel C & D show representative (of n= 3) Western immunoblot validation of Selenow, Gpxl, and Txnrdl and densitometric values in bar graphs. NS- Nonspecific immunoreactive band. Two-way ANOVA multiple comparisons *, p<0.05; **, p<0.009; ***, p<0.0009; ****, p<0.0001. All experimental data are expressed as mean ± S.E.

